
AuctionsUS
Total losses hit 26% of claims while the US used median rose 4.4% to $23,998
US used market, Sep 2026, dealer-website sold data
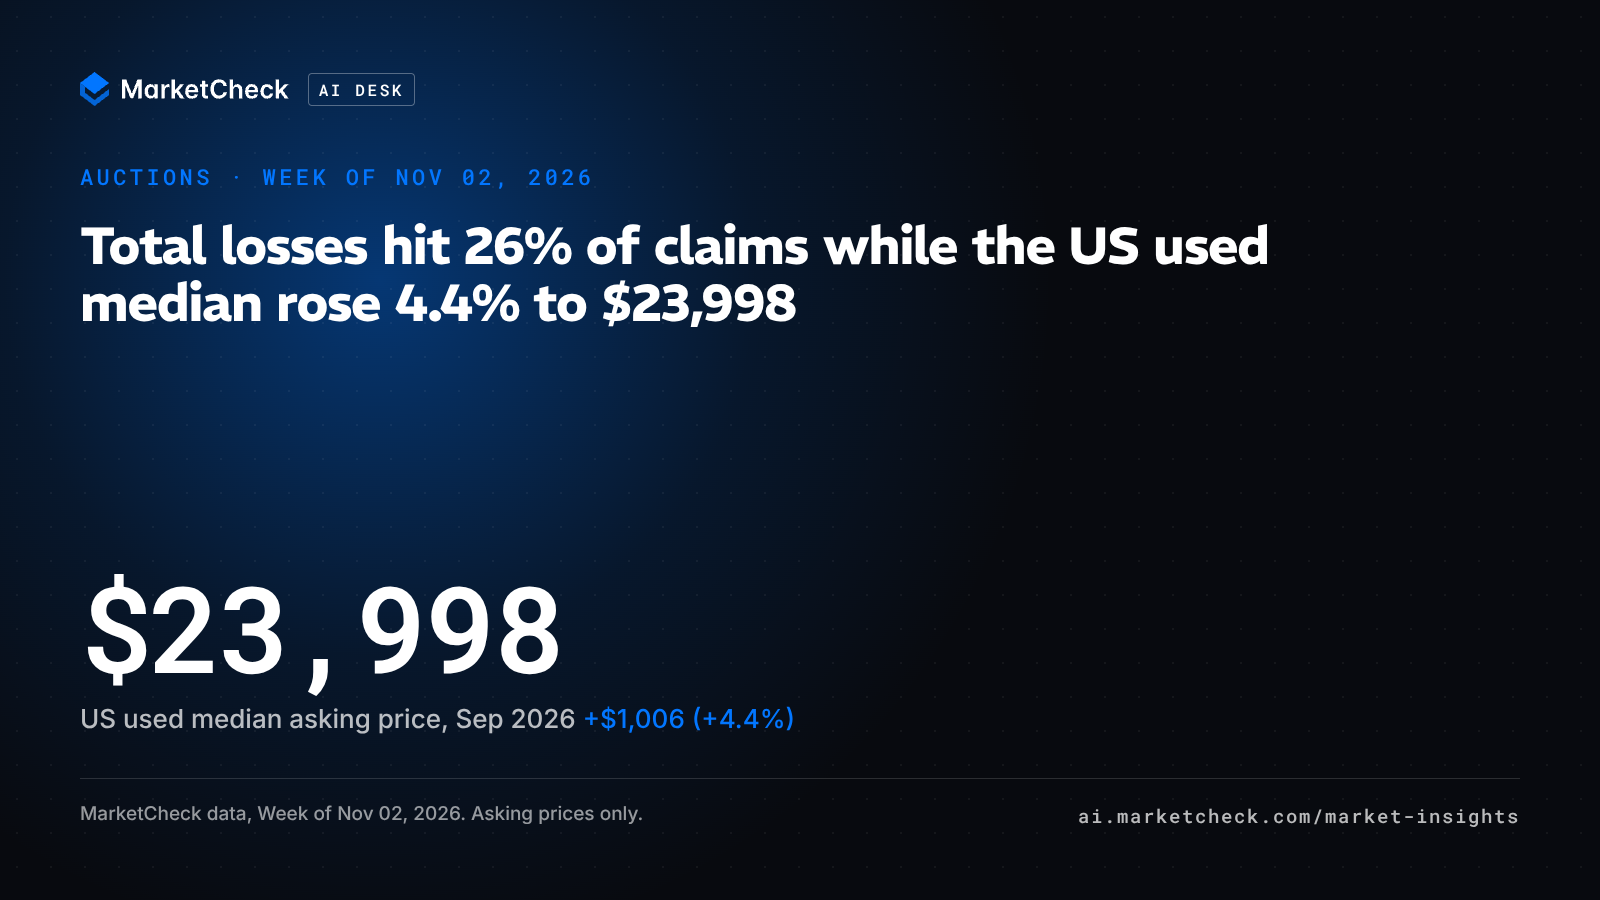
Collision Repair Magazine reported on Oct 29, 2026 that J.D. Power's 2026 U.S. Auto Claims Satisfaction Study puts total losses at 26% of US auto insurance claims, up from 16% four years earlier, with repair cycle times shortening at the same time. That is a US story, and it lands in a US used market that has grown more expensive over the same window: MarketCheck sold-vehicle data from US franchise and independent dealer websites shows the used median asking price rose 4.4% in a year, from $22,992 in Sep 2025 to $23,998 in Sep 2026. Settlements are sized against older, cheaper cars, while the replacement shopping happens at that higher median. MarketCheck data here is retail only: dealer-website sales at advertised asking prices. Salvage and wholesale volumes, including Insurance Auto Auctions, sit outside this data. The figures below size the retail market a total-loss claimant re-enters.
What the data shows
| Measure (US used, dealer websites) | Sep 2025 | Sep 2026 | Change |
|---|---|---|---|
| Vehicles sold (units) | 1,557,527 | 1,588,723 | +2.0% |
| Median asking price ($) | 22,992 | 23,998 | +$1,006 (+4.4%) |
| Median mileage (miles) | 62,294 | 59,181 | -3,113 (-5.0%) |
| Median days on market (days) | 24 | 26 | +2 days |
Reading: a year on, more used cars sold, at a higher median asking price and lower median mileage, and they took two days longer to sell. Prices in the table are advertised asking prices on priced sales, not transaction prices.
By model year, the picture splits. In Sep 2026 the 2024 cohort carried a median asking price of $30,429, 26.8% above the US used median, with median mileage of 30,867 and 30 median days on market. The 2019 cohort sat at $19,773, 17.6% below the median. The 2016 cohort sat at $14,332, 40.3% below, and the 2012 cohort at $9,170, 61.8% below. From 2019 back, every model year listed sold below the $23,998 median and faster than the 2024 cohort, with the 2012 cohort moving in 17 median days.
Why it matters
The cars being written off are the cheap ones. In Sep 2026 a 2019 model carried a median asking price of $19,773 on US dealer websites and a 2015 model $12,995, MarketCheck data shows. VinAudit puts most state total-loss thresholds between 51% and 80% of actual cash value, so on vehicles valued near those medians a modest repair bill crosses the line quickly.
The replacement car costs more than it did a year ago. The US used median asking price on sold vehicles rose $1,006 in twelve months, to $23,998. A driver paid out around the 2015-model median of $12,995 is shopping in a market whose middle sits $11,003 higher.
Older stock already turns fast. Median days on market ran 17 days for 2012 models and 19 days for 2015 models in Sep 2026, against 30 days for 2024 models. Total-loss claimants add buyers to the quickest-turning, lowest-priced end of dealer inventory.
The retail middle has been steady. MarketCheck data shows the used median has moved only from $23,984 to $23,998 since Jun 2026. The year-on-year increase came earlier in the window rather than in the most recent months.
Salvage supply follows the same profile. MarketCheck research on salvage and auction listings for the week of Sep 07, 2026 found a median model year of 2016 and median mileage of 112,012, close to the retail profile of the model years selling furthest below the median. A rising total-loss share feeds that supply directly.
What to watch
- The Oct and Nov 2026 used median asking price. If it breaks out of the $23,984 to $23,998 range MarketCheck data has shown since Jun 2026, the gap between older-car values and replacement cost shifts with it.
- Days on market for 2016 and older model years, which ran 17 to 20 days in Sep 2026. If those shorten further, dealers sourcing that stock face faster turns and thinner supply.
- Median mileage on sold used vehicles, down 3,113 miles year on year to 59,181. A continued decline points to a newer mix reaching dealer websites.
- Salvage auction volumes and the median age of salvage listings, which track the total-loss share rather than total claim counts.
- Repair cycle times, reported at 15.3 days in Q1 2026, 10 days shorter than Q1 2024, as the counterweight to the write-off share.
How this was measured
Monthly sold-vehicle statistics from US franchise and independent dealer websites. Prices are advertised asking prices on priced sales, not transaction prices, and auctions and private sales are excluded. Sep 2026 is the latest complete month because the data lags about two months, and the year-on-year comparison runs Sep 2025 against Sep 2026. Model-year figures are medians for Sep 2026, and each gap compares a model-year median with the Sep 2026 US used median of $23,998.
The read used the MarketCheck Sold Summary API (the get_sold_summary tool in the MarketCheck MCP; docs Sold Summary tool), queried national, used inventory, for the twelve months to Sep 30, 2026, for Sep 2025 as the year-on-year base, and ranked by model year for Sep 2026. Data label: MarketCheck sold-vehicle data, US dealer websites. API keys: MarketCheck developer portal.
The story we checked
"Total Loss Claims Reach 26% of U.S. Auto Claims, Repair Cycle Times Shorten," Collision Repair Magazine, Oct 29, 2026. Fact-check tally: 4 verified, 1 unverifiable. Verified: total losses at 26% of US auto insurance claims in 2026; the 16% share four years earlier; average repair cycle times of 15.3 days in Q1 2026, 10 days shorter than Q1 2024; and most state total-loss thresholds sitting at 51% to 80% of actual cash value. Unverifiable: that vehicles seven years or older made up 74.3% of total-loss valuations in H1 2026, cited from a CCC report in earlier MarketCheck research and not independently checked here. An earlier MarketCheck Take, dated Oct 19, 2026, reported total losses at 23.5% of claims; that figure comes from a different study and measure and is not a contradiction of J.D. Power's 26%.
You can run the same read in MarketCheck AI Desk: https://ai.marketcheck.com/install.
Reproduce this
- search_past_90_days: Pull listings that left US dealer websites in the last 90 days at their last asking price, filtered to 2016 and older model years.
- search_active_cars: Check live dealer listings for the same model years to see how today's asking prices compare with the Sep 2026 medians.
- generate_brand_model_market_pulse: Read demand in the US used market for a single make or model you stock in the older, lower-priced band.
- generate_market_movers: See what is moving in one US metro before sourcing older, fast-turning inventory.
The story we checkedTotal Loss Claims Reach 26% of U.S. Auto Claims, Repair Cycle Times Shorten, Collision Repair Magazine, Oct 29, 2026
More stories
AI condition reports are in wholesale lanes; retail used units, starting with aged stock, are next
AI condition reports are spreading from auctions to retail. US used median sold price hit $23,998 in Sep 2026, up 4.4% on Sep 2025.
Nov 2, 2026Week of Nov 2, 2026
Copart closes ACV deal: dealers face one wholesale owner with used retail prices flat since May 2026
Copart closed its $1.9B ACV Auctions deal as US used retail prices sit flat since May 2026 and 4.4% above Sep 2025, per MarketCheck data.
Oct 19, 2026Week of Oct 19, 2026
Copart-ACV deal nears antitrust deadline as used retail prices rise 4.3% year on year
Copart's $1.9B ACV Auctions offer waits on antitrust review as the US used median asking price holds at $23,988 in Aug 2026.
Oct 12, 2026Week of Oct 12, 2026
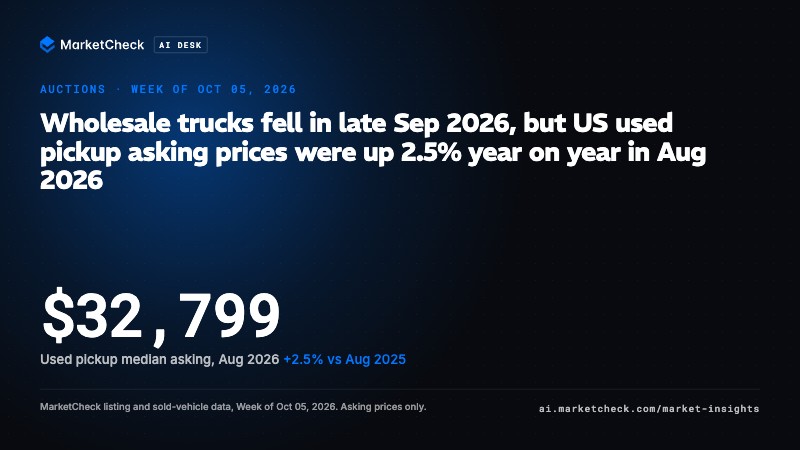
Wholesale trucks fell in late Sep 2026, but US used pickup asking prices were up 2.5% year on year in Aug 2026
Wholesale fell 0.71% in late September, but used pickup asking prices hit $32,799 in Aug 2026, up 2.5% year on year.
Oct 5, 2026Week of Oct 5, 2026
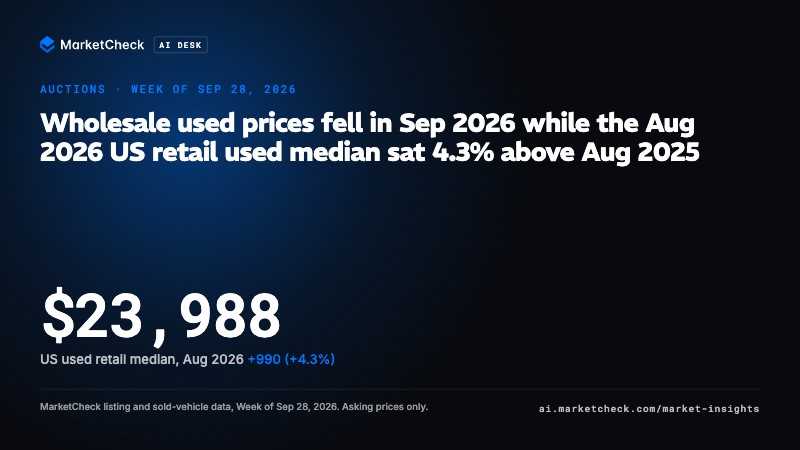
Wholesale used prices fell in Sep 2026 while the Aug 2026 US retail used median sat 4.3% above Aug 2025
Wholesale used prices fell 1% in Sep 2026 and Manheim dipped 0.4% YoY, but the US used retail median was $23,988 in Aug 2026, up 4.3%.
Sep 28, 2026Week of Sep 28, 2026