
RetailersUS
CarMax website used sales rose 12% year on year in Sep 2026, against a used market up about 2%
CarMax's online used sales grew six times faster than a market up about 2%, so its unit gains are coming from rival dealers.
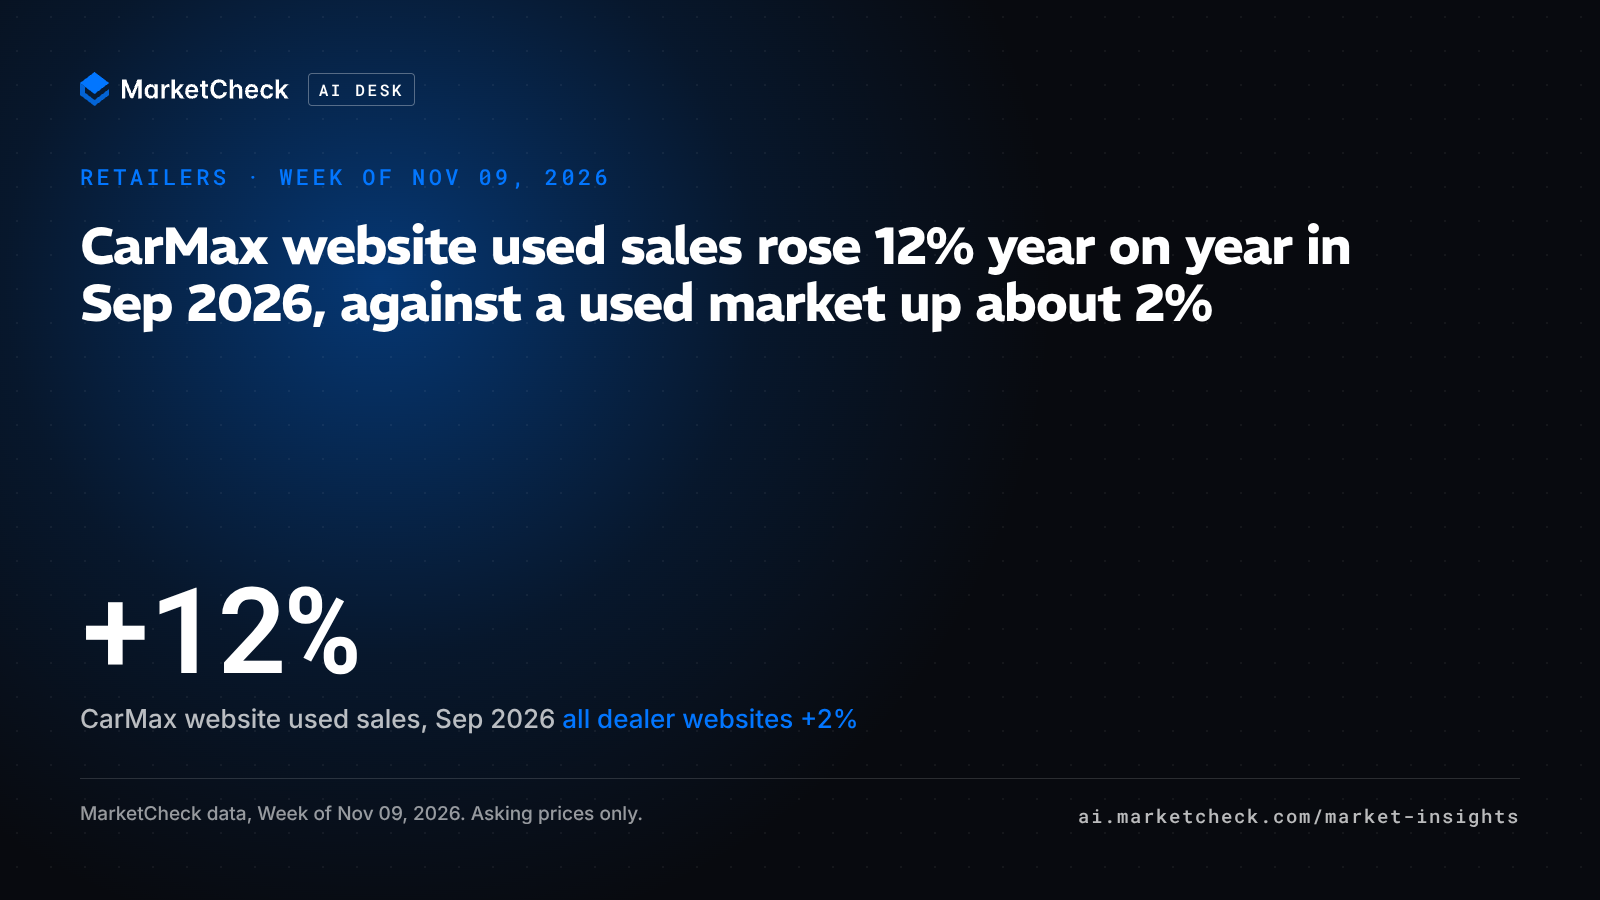
CarMax, Inc. presented its "Shift into GEAR" strategy on Nov 03, 2026, targeting mid-single-digit used retail unit CAGR and mid-teens adjusted EPS CAGR through fiscal 2030. MarketCheck data on the US used market shows used vehicles leaving carmax.com had already reached 66,255 in Sep 2026, up 12% from 59,130 in Sep 2025, while all US dealer websites moved from 1,557,527 to 1,588,723, a gain of about 2%. On that measure the retailer grew six times faster than the market and is running ahead of the target pace on its own website. A mid-single-digit unit target reads as steady, and in a pool growing at roughly 2%, growth of that order still has to come from somewhere.
| Measure, US used | CarMax website, Sep 2025 | CarMax website, Sep 2026 | Change | All dealer websites, Sep 2025 | All dealer websites, Sep 2026 | Change |
|---|---|---|---|---|---|---|
| Units sold (count) | 59,130 | 66,255 | +12% | 1,557,527 | 1,588,723 | +2% |
| CarMax share of dealer-website sales (%) | 3.80 | 4.17 | +0.37 pts | |||
| Median asking price ($) | 23,998 | 25,998 | +8% | 22,992 | 23,998 | +4% |
| Median mileage (miles) | 46,469 | 39,476 | -15% | 62,294 | 59,181 | -5% |
| Median days on market (days) | 28 | 25 | -3 days | 24 | 26 | +2 days |
Share of dealer-website sales rose to 4.17%
CarMax's share of used sales on US dealer websites went from 3.80% in Sep 2025 to 4.17% in Sep 2026, a gain of 0.37 points. Franchise and independent dealers are competing for a pool that grew about 2% over the same stretch. Holding above 4% while the market grows about 2% means units are moving away from rivals.
The top of used retail is consolidating. MarketCheck research, "How concentrated is US auto retail among the top dealership groups?", found CarMax and Carvana took 30.6% of top-50-group used revenue in Aug 2025 and 36.2% by Jul 2026, a 5.6-point gain.
Lower mileage accounts for much of the $2,000 price gap
CarMax's median mileage on cars leaving its website was 39,476 in Sep 2026 against 59,181 across all dealer websites, and its median asking price was $25,998 against $23,998 for the market. With about 20,000 fewer miles, much of that $2,000 difference reflects what is being listed before it reflects how it is priced. Both figures are advertised asking prices. Over the year its median mileage fell 15% and its median asking price rose 8%, against a 5% fall and a 4% rise for the market.
Dealers holding older inventory overlap less directly with the shopper for such cars; dealers chasing late-model trade-ins and off-lease supply overlap more. If CarMax keeps sourcing cars near 40,000 miles, dealers competing for the same late-model supply face higher acquisition costs. Its stock also turned faster, with median days on market falling from 28 in Sep 2025 to 25 in Sep 2026 while the market's rose from 24 to 26. If the market figure keeps rising while the carmax.com figure falls from 25, slower-turning stores carry more aged-inventory risk.
One month against a fiscal 2030 target
A count of cars leaving a retailer's website is a different measure from reported retail units, and a single month says little about a four-year compound rate. The 12% figure is a directional read on online retail activity and passes no verdict on the fiscal 2030 target.
CarMax website units peaked at 76,440 in Mar 2026, which makes the Mar 2027 spring peak the cleanest seasonal comparison for whether website growth holds. Sep 2026 fell 10% from Aug 2026, against a 7% drop for all dealer websites, so the year-on-year advantage did not show up as a sequential climb in the latest month.
How this was measured
Monthly sold-vehicle statistics of used listings that left US franchise and independent dealer websites, excluding auctions and private sales. Prices are advertised asking prices, and the figures shown are medians. CarMax figures cover cars leaving carmax.com, not CarMax's reported retail units. Year on year compares Sep 2026 with Sep 2025. The two latest months are provisional and typically revise up by 0.1% to 1.5%, so Aug 2026 and Sep 2026 may move slightly.
The read used MarketCheck data, specifically MarketCheck sold-vehicle statistics for US used vehicles sold from dealer websites and from carmax.com, Sep 2025 to Sep 2026, pulled with the MarketCheck Sold Summary API (the get_sold_summary tool in the MarketCheck MCP; docs Sold Summary tool). API keys: MarketCheck developer portal.
The story we checked
"CarMax Outlines Strategy to Strengthen Core Operations and Deliver Robust Growth", CarMax, Inc., Nov 03, 2026. Fact-check tally: 5 verified, 0 unverifiable. The verified claims cover the "Shift into GEAR" presentation date, the mid-single-digit used retail unit CAGR target through fiscal 2030 from a fiscal 2026 base, the mid-teens adjusted EPS CAGR target, CarMax gaining ground on the rest of US used retail, and CarMax and Carvana consolidating the top of used retail.
You can run the same read in MarketCheck AI Desk: https://ai.marketcheck.com/install.
Reproduce this
- search_past_90_days: Pull used listings that left US dealer websites in the last 90 days at their last asking price, then compare carmax.com against all sources.
- generate_brand_model_market_pulse: Check demand in the US used market for the makes and models that sit in the sub-40,000-mile band CarMax is selling.
- search_active_cars: Filter live dealer listings by price band and mileage to see how your current stock lines up with a $25,998 median.
The story we checkedCarMax Outlines Strategy for Core Operations and Growth through 2030, CarMax, Inc., Nov 3, 2026
More stories

EU's €2 per-item fee on eBay sellers hits parcels, not dealer car stock
The EU's €2 per-item handling fee hits eBay parcel sellers. MarketCheck data finds 0 US used dealer listings sourced from ebay.com on Nov 9, 2026.
Nov 9, 2026Week of Nov 9, 2026
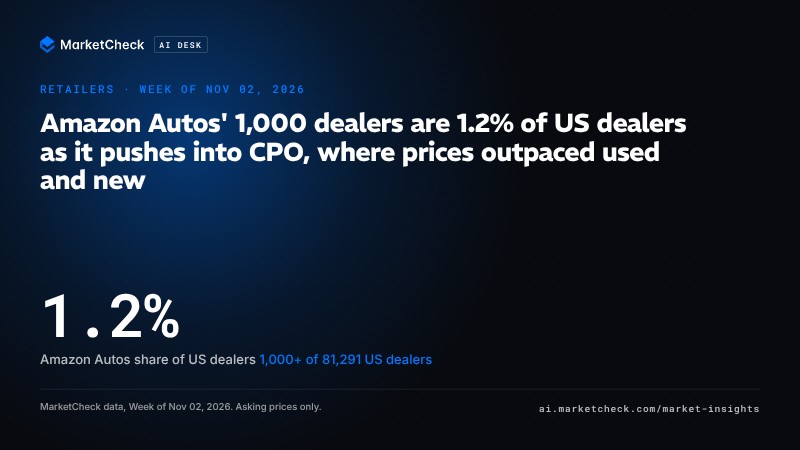
Amazon Autos' 1,000 dealers are 1.2% of US dealers as it pushes into CPO, where prices outpaced used and new
Amazon Autos' 1,000+ dealers are about 1.2% of 81,291 US dealers, as certified pre-owned median asking prices rose 4.7% to $32,429 in Sep 2026.
Nov 2, 2026Week of Nov 2, 2026
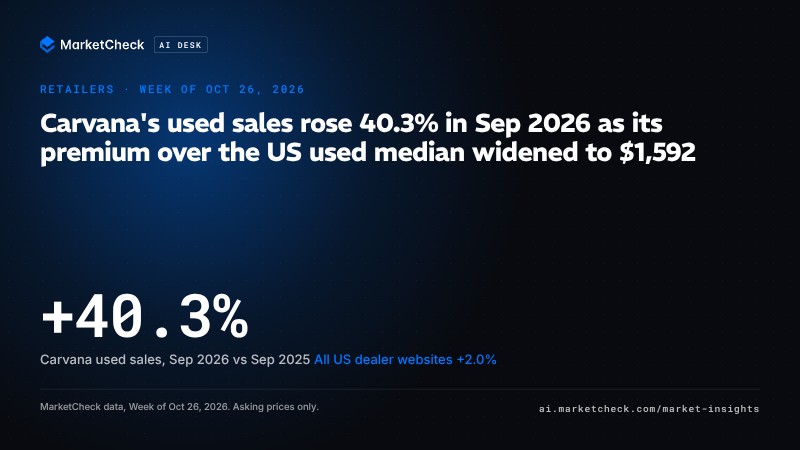
Carvana's used sales rose 40.3% in Sep 2026 as its premium over the US used median widened to $1,592
Carvana's profit per unit fell $412, yet its Sep 2026 used sales rose 40.3% at a median ask $1,592 above the US used median.
Oct 26, 2026Week of Oct 26, 2026
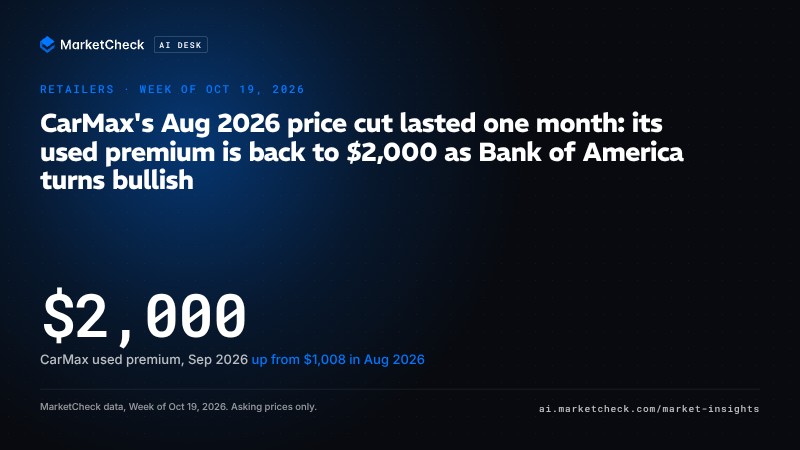
CarMax's Aug 2026 price cut lasted one month: its used premium is back to $2,000 as Bank of America turns bullish
MarketCheck data: CarMax's Sep 2026 median used ask of $25,998 sat $2,000 above the US median of $23,998, double the $1,008 gap in Aug 2026.
Oct 19, 2026Week of Oct 19, 2026
CarMax bought 13.8% used-unit growth with price: its premium over the US used median fell to $1,010 in Aug 2026
CarMax's used sales rose 13.3% to 16.0% a month as its median ask fell to $24,998, halving its premium over the US used market in Aug 2026.
Oct 5, 2026Week of Oct 5, 2026