
DealersUS
Group 1's Q3 2026 miss shows in used cars: dealer-website used sales fell 9.2% to 20.9% year on year
Group 1 trailed the US market in new and used sales every month of Q3 2026 while it raised used prices and deepened new-car discounts.
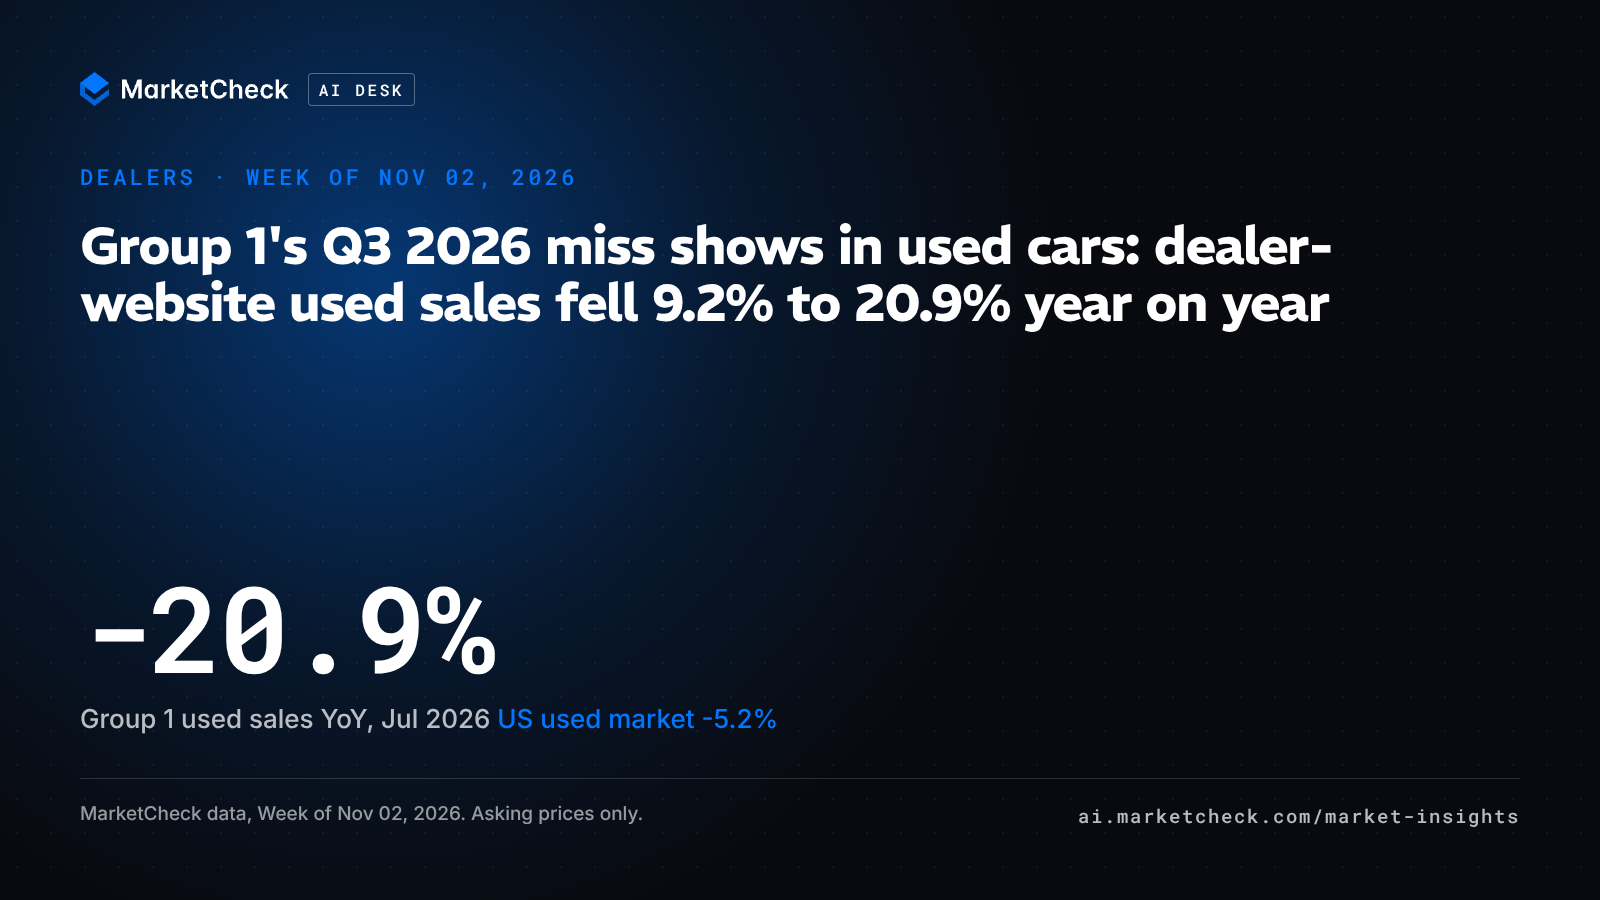
Group 1 Automotive reported Q3 2026 earnings and revenue below Wall Street expectations on Oct 28, 2026, citing softer US vehicle sales and affordability pressures, per Investing.com. Read through the US market data, the softness is clearest in used cars: MarketCheck data shows Group 1's US dealer-website used sales fell between 9.2% and 20.9% year on year in each month of Q3 2026, and trailed the US used market every month. Over the same quarter the group's median used asking price rose faster than the market's, and its mean new-vehicle discount to MSRP widened while the US market's narrowed.
What the data shows
| Month | Group 1 new 2026 (units) | Group 1 new 2025 (units) | Group 1 new YoY (%) | Group 1 used 2026 (units) | Group 1 used 2025 (units) | Group 1 used YoY (%) | US new YoY (%) | US used YoY (%) |
|---|---|---|---|---|---|---|---|---|
| Jul | 13,762 | 16,264 | -15.4% | 12,420 | 15,692 | -20.9% | -9.5% | -5.2% |
| Aug | 15,533 | 17,080 | -9.1% | 13,000 | 15,970 | -18.6% | -3.0% | -1.7% |
| Sep | 14,945 | 15,185 | -1.6% | 12,372 | 13,633 | -9.2% | +0.6% | +2.0% |
Reading the table: Group 1 fell further than the US market in both new and used in every month of Q3 2026, and the used gap stayed above 11 points even as new sales converged, with Group 1 new units down 1.6% in Sep 2026 against a US new market up 0.6%. Figures are new and used vehicles sold off US dealer websites, Group 1 Automotive Inc. and all US dealers, Jul to Sep 2026 against Jul to Sep 2025, same calendar month.
The price and turn picture for Sep 2026 sits alongside the volume picture. Group 1's median used asking price rose 5.8%, from $26,196 to $27,725, against a 4.4% rise for the US used market, from $22,992 to $23,998. Its median new asking price moved 0.4%, from $47,351 to $47,560. On discounting, Group 1's mean new price went from 1.53% below MSRP in Sep 2025 to 2.02% below MSRP in Sep 2026, 0.49 points deeper, while the US mean moved from 3.55% to 3.23% below MSRP, 0.32 points thinner. Group 1's median used days on market went from 20 to 22, the US used median from 24 to 26, and Group 1's median new days on market from 36 to 35. Prices here are advertised asking prices, and the MSRP comparison is a mean, not a median.
Why it matters
The used gap is specific to the group, not a market-wide slump. Group 1's used units fell 20.9% in Jul 2026 while US dealer-website used sales fell 5.2%, a gap of about 16 points in a month when the wider used market declined only modestly.
Price held above the market while units fell. A 5.8% rise in Group 1's median used asking price against 4.4% for the US used market is the profile of a retailer holding price through a softer quarter, and it leaves room for competing used retailers in the same markets.
Used stock still turns faster at Group 1 than the US median, 22 days against 26 days in Sep 2026, so slower turn alone does not explain the volume gap.
On new cars the group discounted more deeply, not less, and still sold fewer units than a year earlier. The widening of its mean discount to MSRP ran opposite to the market's narrowing.
The decline narrowed through the quarter. Group 1's new units went from -15.4% in Jul 2026 to -1.6% in Sep 2026, close to the market's +0.6%. Used is where the gap persisted, at -9.2% against +2.0% in Sep 2026.
Group 1's combined units fell 5.2% in Sep 2026, from 28,818 to 27,317. Earlier MarketCheck research on the eight largest US dealer groups by units showed that as the steepest September decline in that group.
What to watch
- Group 1's used units against the US used market in Oct and Nov 2026. A gap still above 10 points would point to sourcing or pricing at the group rather than to buyer demand.
- The spread between Group 1's median used asking price and the US median. If price holds while units fall, used volume is available to other dealers in its markets.
- Whether Group 1's mean new discount stays deeper than Sep 2025 while the US mean keeps thinning.
- Used days on market on both lines. Both medians added 2 days year on year in Sep 2026, so a further move would show whether the slower turn is market-wide.
How this was measured
Sales are listings that left US franchise and independent dealer websites, excluding auctions and private sales. Prices are advertised asking prices, not transaction prices. Year on year compares the same calendar month, and the data covers months through Sep 2026. Figures come from the MarketCheck Sold Summary API (the get_sold_summary tool in the MarketCheck MCP; docs Sold Summary tool), read for Group 1 Automotive Inc. and for all US dealers by inventory type, Jul to Sep 2025 and Jul to Sep 2026, plus a dealer-group ranking by sold count for Q3 2026. The data source is MarketCheck sold-vehicle data, US dealer websites. API keys: MarketCheck developer portal.
The story we checked
"Group 1 Automotive Misses Q3 Estimates Amidst Softer US Vehicle Sales", Investing.com, Oct 28, 2026. Fact-check tally: 4 verified, 1 unverifiable. Verified: the Oct 28, 2026 results filing; that management cited affordability pressures from negative equity, higher rates, ownership costs and financing terms; a 4.6% decline in US new-vehicle same-store sales, which is a different measure from dealer-website units and is not directly comparable; and that Group 1's US vehicle sales softened in Q3 2026, with new and used units below the same month of 2025 in Jul, Aug and Sep 2026. Unverifiable: the reported adjusted EPS and revenue figures against consensus, where the story is the only source.
You can run the same read in MarketCheck AI Desk: https://ai.marketcheck.com/install.
Reproduce this
- search_past_90_days: Look at listings that left dealer websites in the last 90 days, at their last asking price, to see how used stock is clearing now.
- search_active_cars: Pull live dealer listings, filtered as you ask, to compare current used asking prices against the market.
- generate_market_movers: Check what is moving in one US metro where the group operates.
- generate_full_market_capture: Read every listing in one ZIP code market to see the local used price spread.
The story we checkedGroup 1 Automotive Misses Q3 Estimates Amidst Softer US Vehicle Sales, investing.com, Oct 28, 2026
More stories
EchoPark's Q3 used sales grew year on year as cars sat longer and Aug and Sep asking prices fell
MarketCheck US data: EchoPark website used sales rose 21.4% in Sep 2026 vs Sep 2025, while median days on market rose to 25 from 21.
Nov 2, 2026Week of Nov 2, 2026
Dobbs buys Asheville Mazda and Ram stores as Mazda prices firm and local Ram stock sold at a median 538 days
MarketCheck data: Asheville Mazda sold faster above MSRP in Sep 2026, while new Ram units sold had sat a median 538 days at 19.34% below MSRP.
Oct 26, 2026Week of Oct 26, 2026
Lithia aims for $100B in revenue while its dealer-website sales fell 4.1% in Sep 2026
Lithia beat Q3 2026 estimates and set a $75B to $100B target, but MarketCheck data shows its Sep 2026 sales fell 4.1% year on year.
Oct 26, 2026Week of Oct 26, 2026
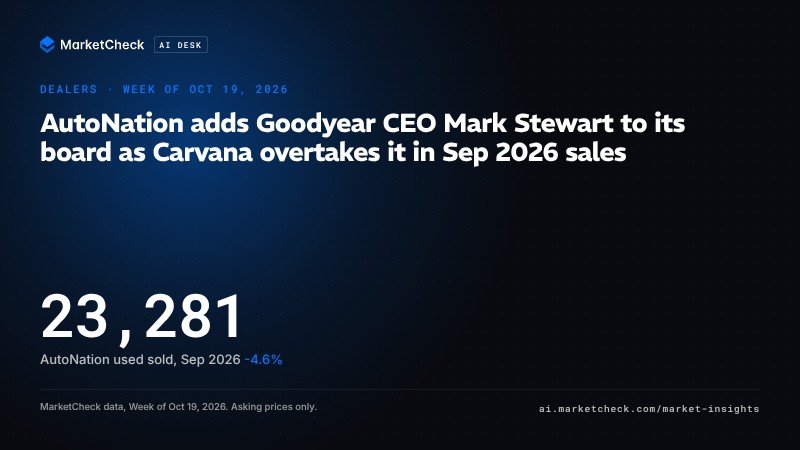
AutoNation adds Goodyear CEO Mark Stewart to its board as Carvana overtakes it in Sep 2026 sales
AutoNation names Goodyear CEO Mark Stewart to its board as its Sep 2026 US dealer-website sales fall 1.8% and Carvana moves ahead on units.
Oct 19, 2026Week of Oct 19, 2026
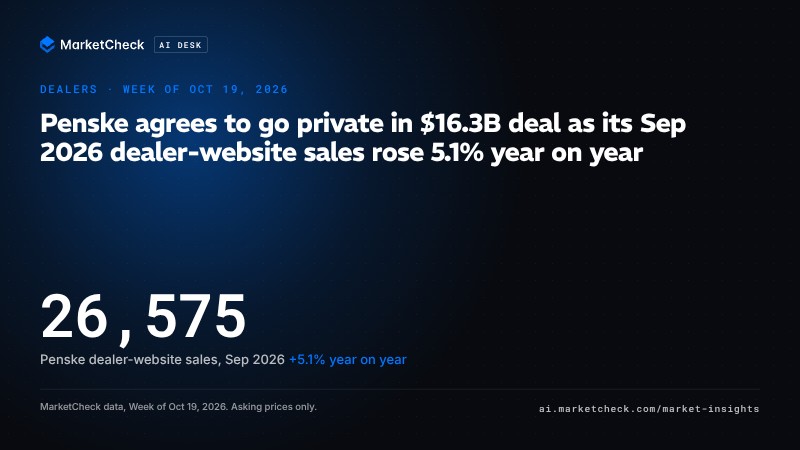
Penske agrees to go private in $16.3B deal as its Sep 2026 dealer-website sales rose 5.1% year on year
Penske Automotive Group goes private at $212 a share. MarketCheck data: Sep 2026 US dealer-website sales rose 5.1% year on year, to 26,575 units.
Oct 19, 2026Week of Oct 19, 2026