
Used Car Market Analysis for Dealers: A Sandy, UT Case Study
Your whole market, captured before your second coffee
How three Utah dealerships read one Full Market Capture, and the 10 questions that turn it into money
Everything below is real output from Full Market Capture runs in the Sandy, UT market (ZIP 84070, 25 mi, used). All figures are advertised (listed) prices; vehicles that left the market are shown at their last list price, the closest observable proxy to a sale. The report links are live if you want to check our work.
The 8am question
You run a dealership. Every morning asks you the same thing: what moved in my market yesterday, and what should I do about my lot today?
You have a pricing tool that knows your cars, a market report that knows the region, and a gut that knows the business. They rarely agree, and none of them will answer a follow-up question.
Full Market Capture is built to be the one answer. One run captures your entire local market, this morning that meant 25,727 active listings plus 64,683 vehicles that left the market in the last 90 days, works out what sells, how fast, at what price, and where supply is tight or flush, and then puts every unit on YOUR lot up against all of it:
- a comp rank: where your ask sits among the exact cars a shopper cross-shops ("#7 of 12")
- an expected time to sell at your current price, from observed exits of cars like it
- a verdict: ON PACE, LAGGING, or STALLED
- and a MarketCheck Price with an Above / At / Below Market position
It is priced at $9.99 per 10,000 listings analyzed, quoted for free before anything runs. This market was roughly 91,000 rows (active plus 90-day sold), so each store's full report ran about $100. No subscription, no seat license, pay per run. And because the day's capture is shared, we ran it for three very different stores at once: all three reports finished in a combined 252 seconds.
| If you run a... | Like | Units judged | See the real report |
|---|---|---|---|
| Franchise store | A top-volume Toyota franchise | 597 | open |
| Niche specialist | A diesel and truck specialist | 552 | open |
| Volume independent | An EV-focused independent | 1,584 | open |
Store names are masked in these shared copies out of courtesy to the dealerships; every number is unedited.
Reading the report: what one capture hands you
The report reads top to bottom in about ten minutes. Here is the Sandy edition, section by section, the way a dealer reads it:
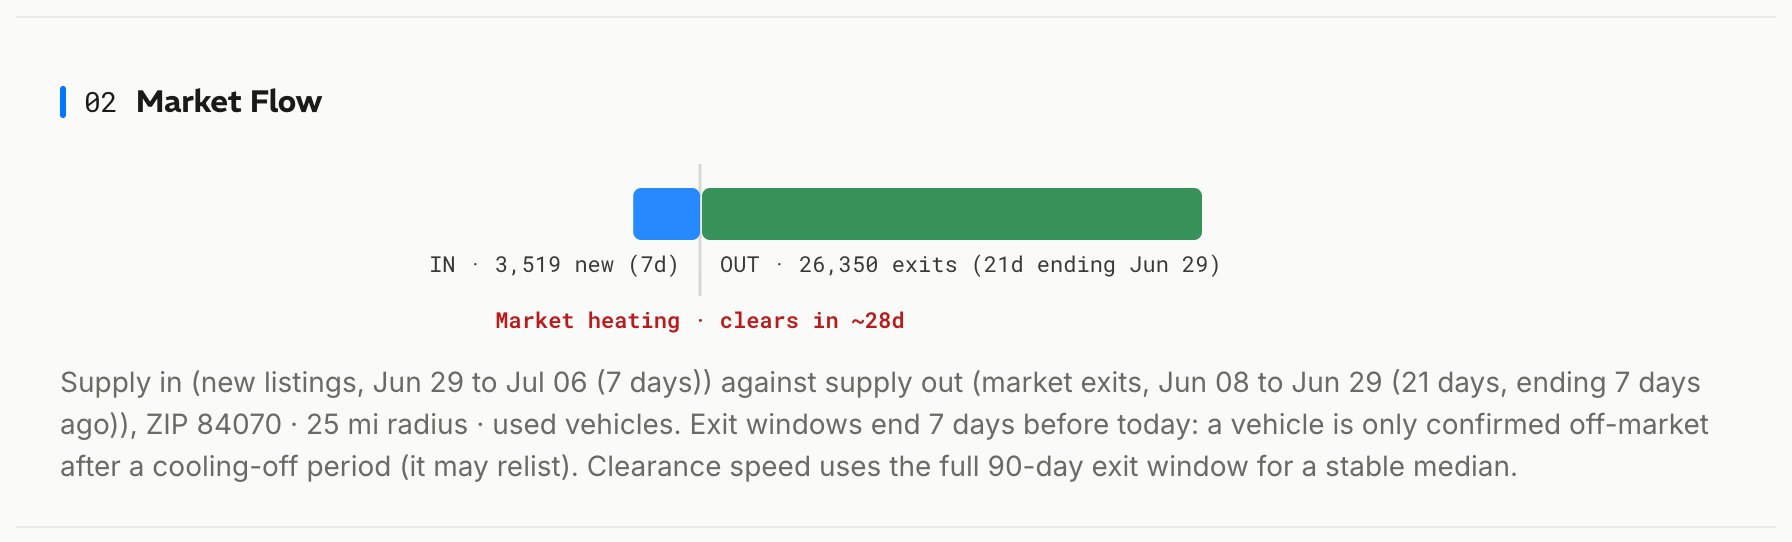
Market Flow. 3,519 vehicles listed this week against ~26,000 exits in 21 days; the market is HEATING and the median car clears in 28 days. Translation: buyers are absorbing inventory faster than it arrives. Hold prices on anything healthy.
Your Lot vs the Market. Every one of your units, judged. This is the section you act on daily, and each store's looked completely different (below).
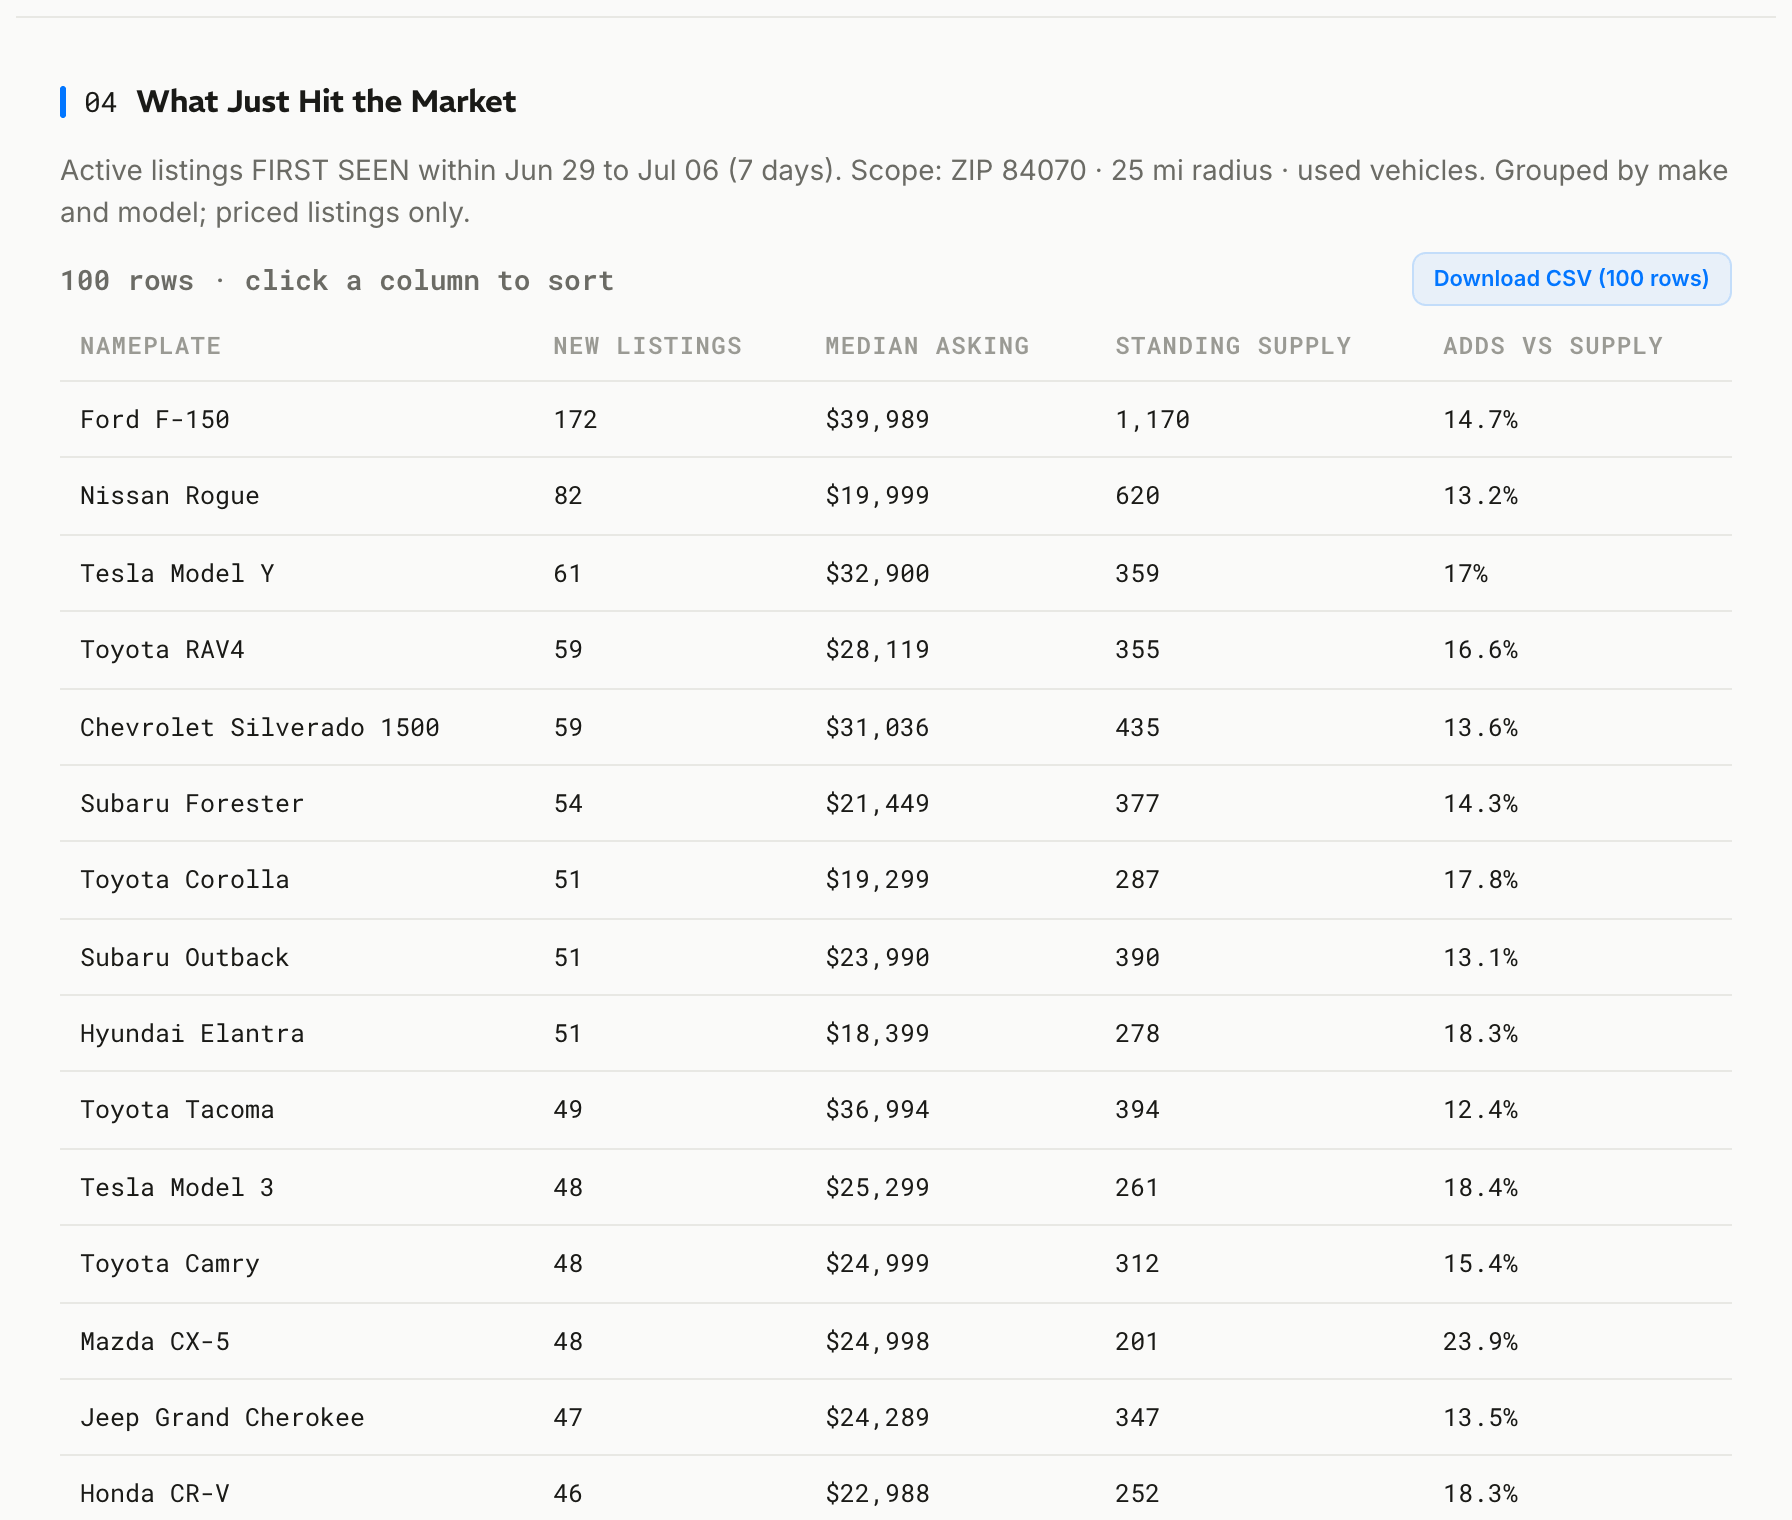
What just hit the market, and who is stocking it. F-150 (+172), Rogue (+82), Model Y (+61) led the week's adds. The biggest restockers: Enterprise (+520), Carvana (+290), and our EV independent (+106). If you compete with any of them, you just learned their week.
Price-cut pressure. Only 3% of supply took a cut, and the cutters are the volume players: Carvana Tooele (147 cuts, median 1.74%), Enterprise (116 cuts, 2.08%). Nobody is panicking, which makes YOUR cuts more visible when you make them.
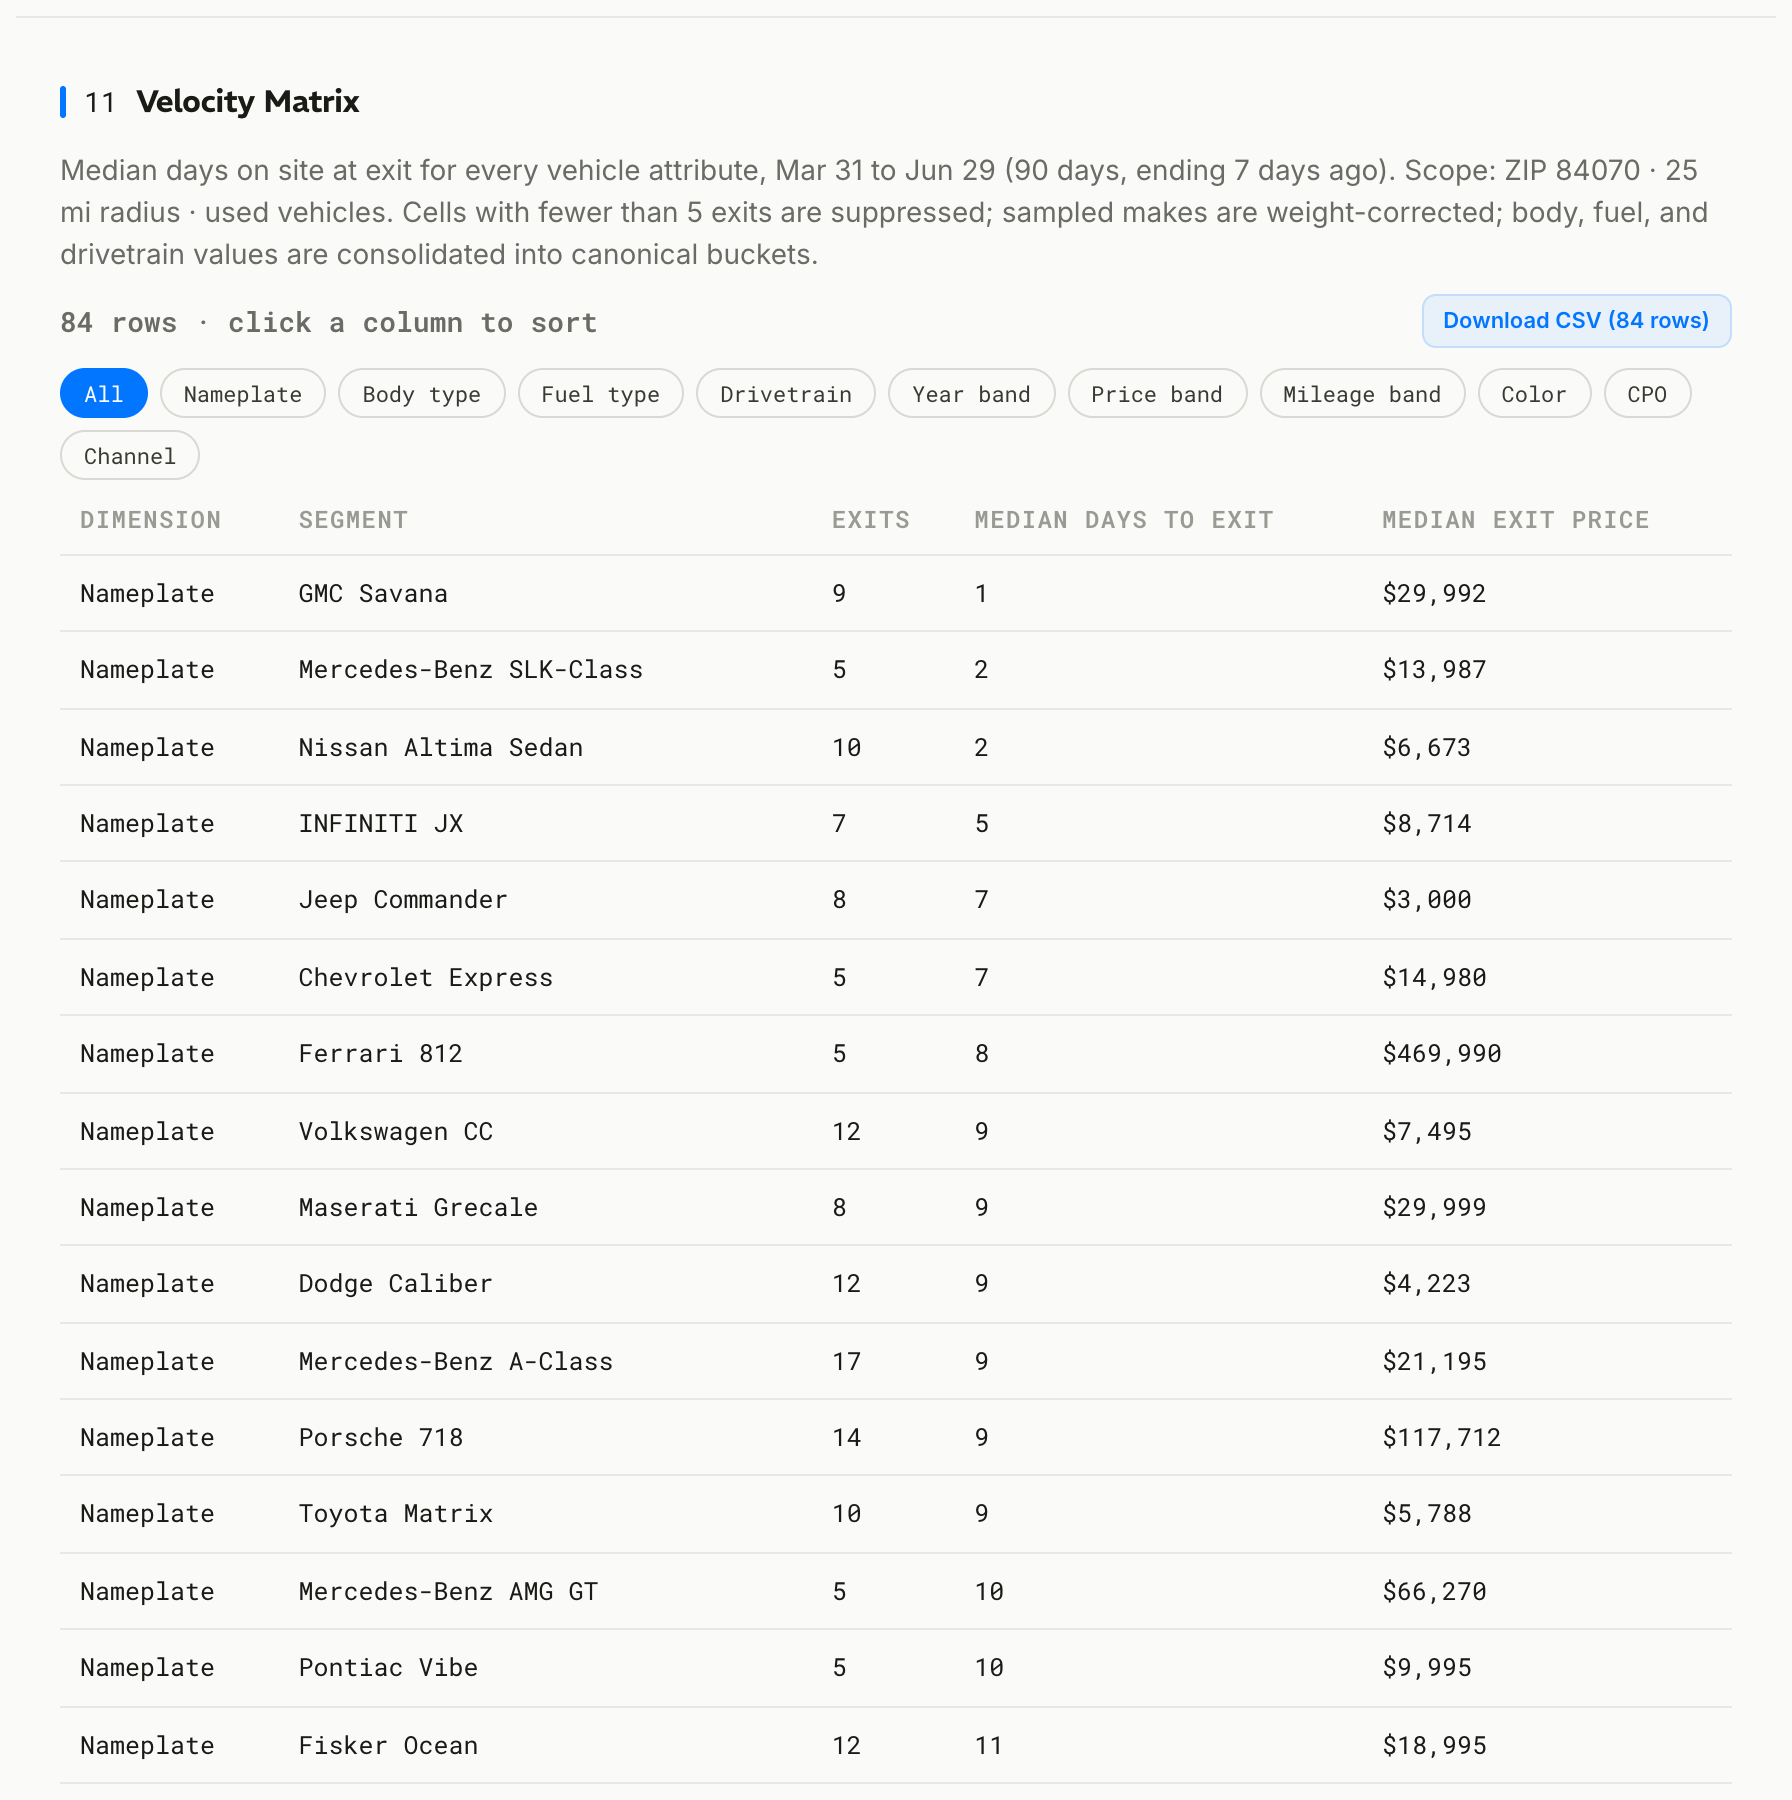
What left, and how fast. The velocity matrix crosses exit speed with everything: nameplate, body, fuel, year, price band, mileage, color, CPO, channel. This morning's surprises: EVs are the fastest fuel in Sandy (21-day median), diesel the slowest (36 days), and the $10-15k price band is the market's most tightening segment.
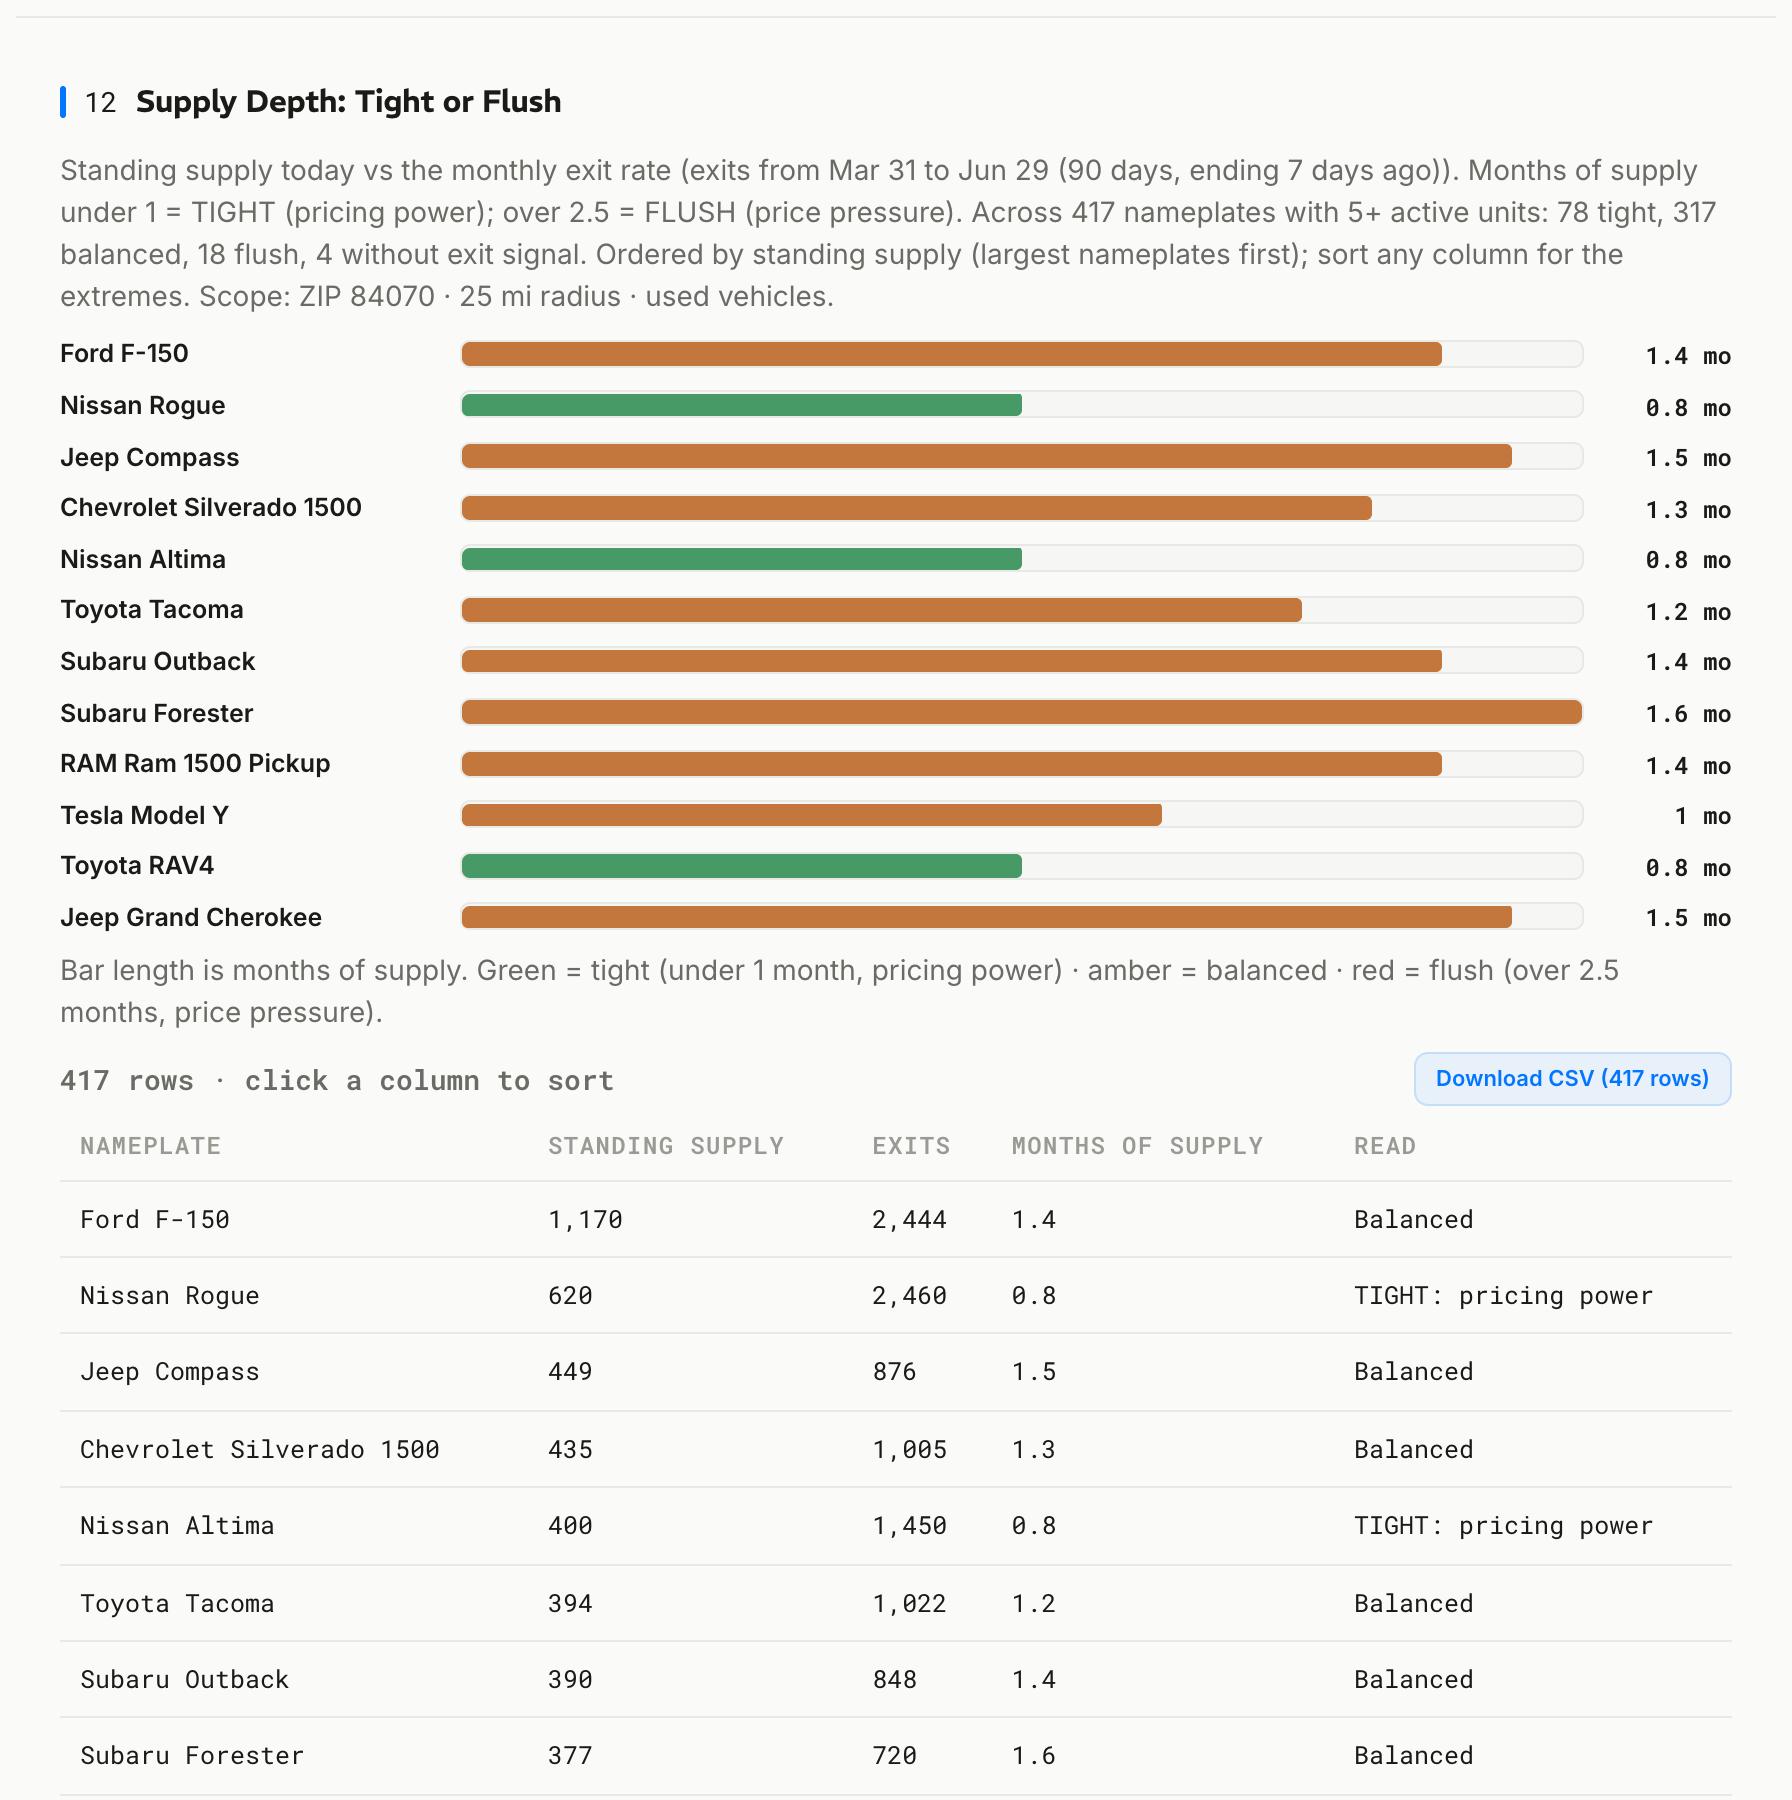
Supply depth. Of 417 nameplates: 78 TIGHT, 321 balanced, 18 FLUSH. RAV4 sits at 0.8 months of supply, Camry 0.7, F-150 a comfortable 1.4.
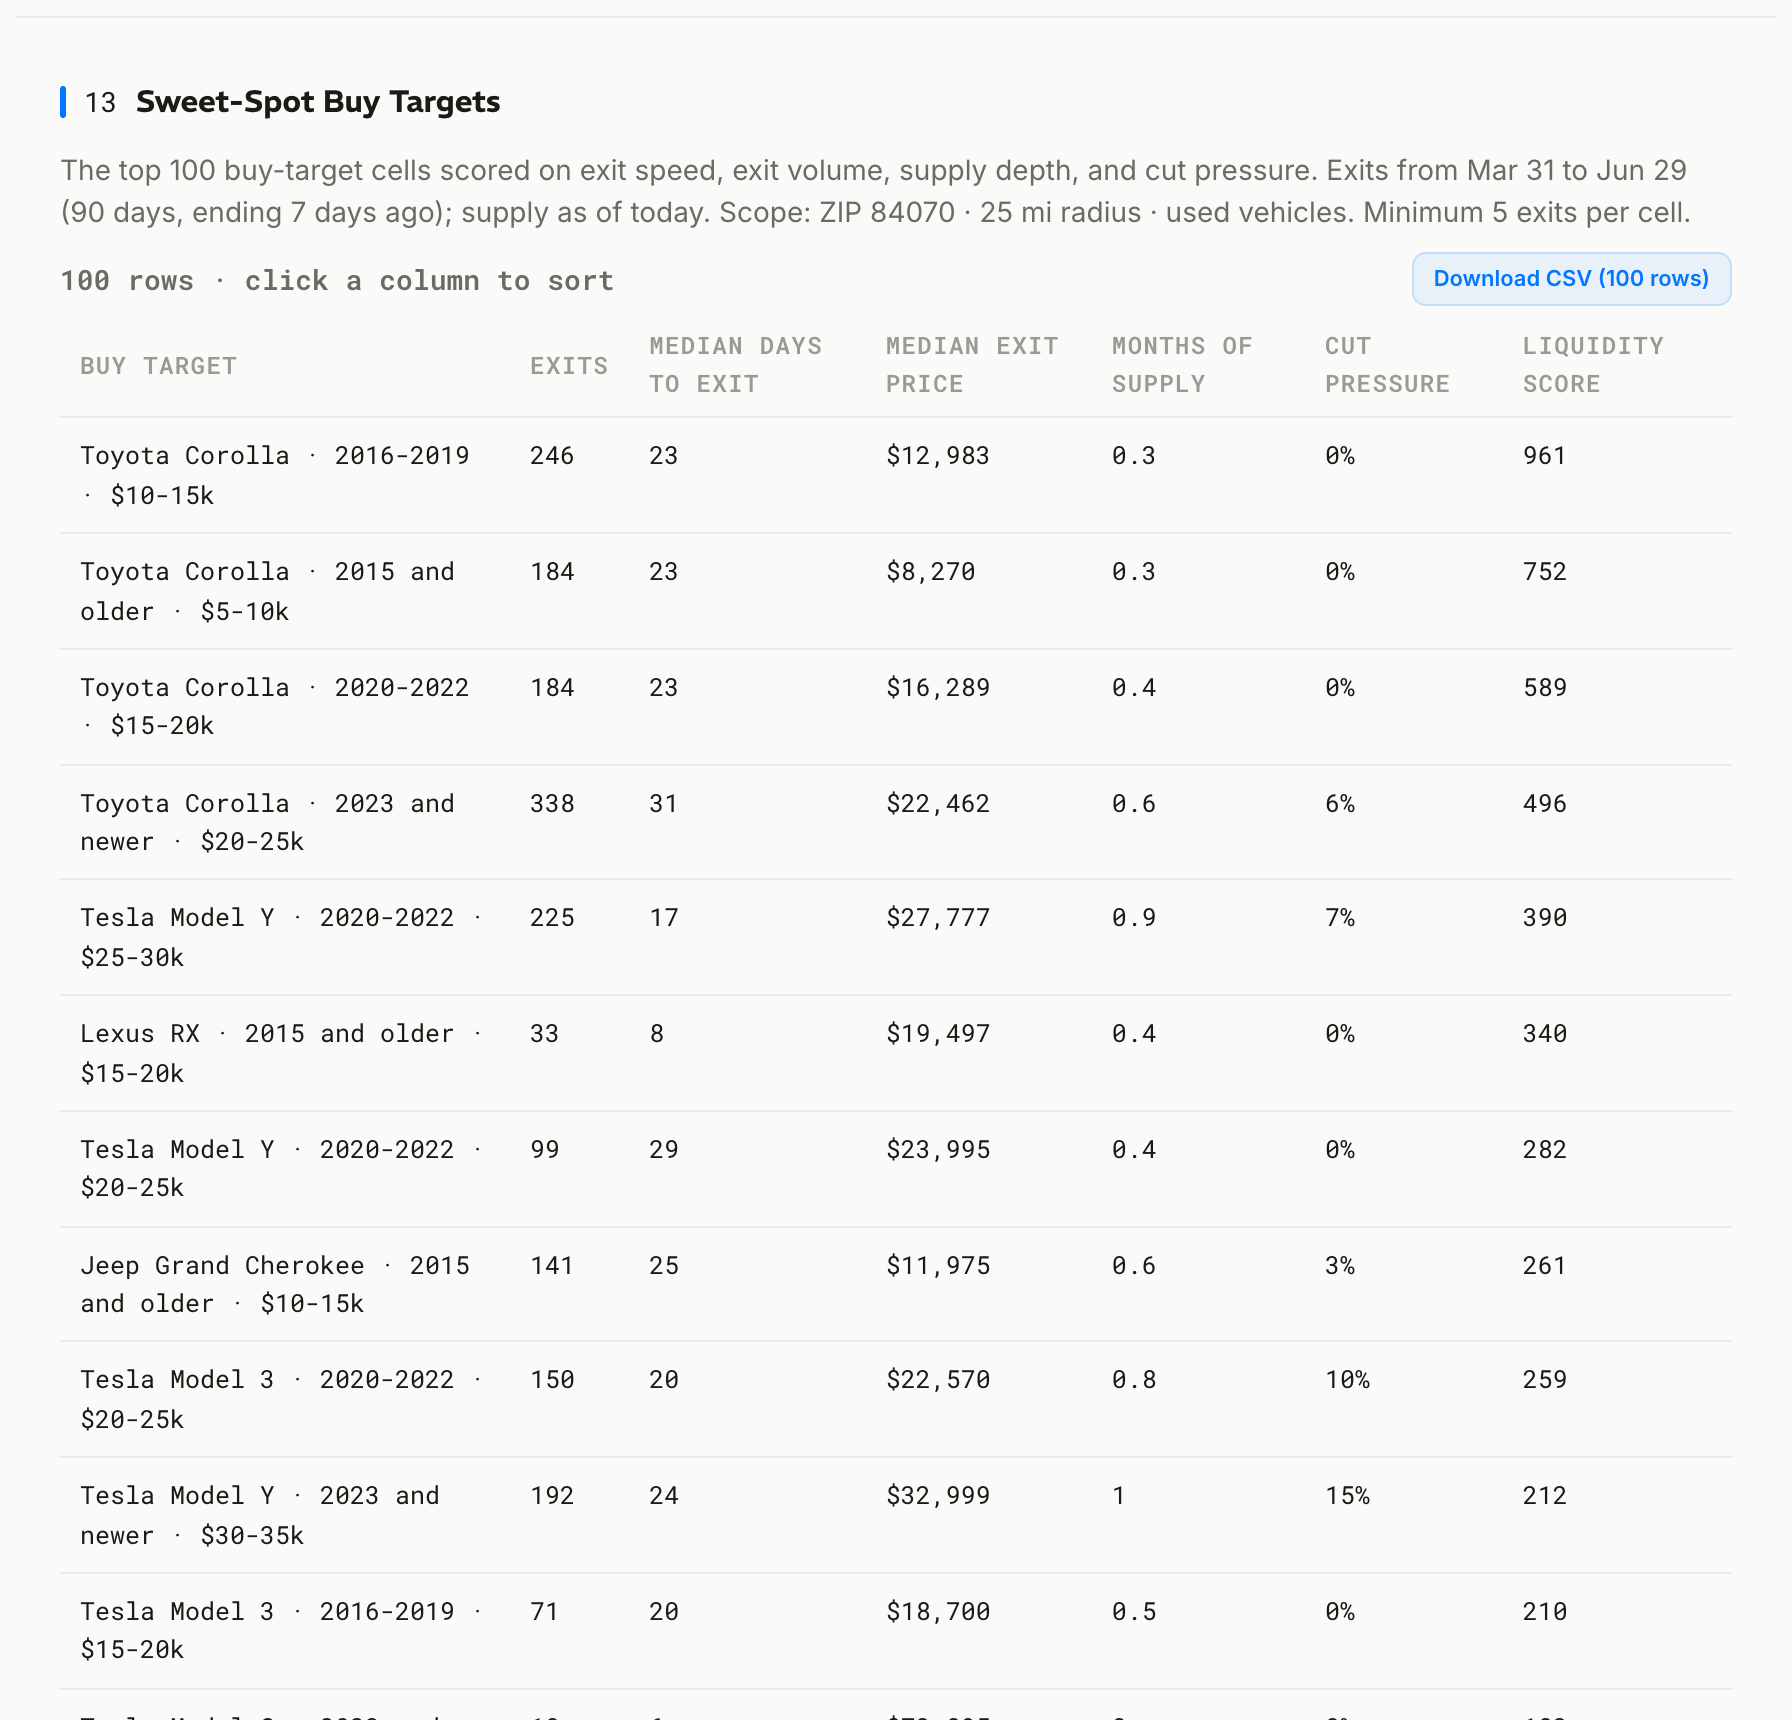
Sweet-spot buy targets. The market's most liquid cells, scored. Sandy's top four are all used Corollas, and the fifth is the 2020-2022 Model Y at $25-30k (17-day exits).
Discount-to-exit. The number every repricing decision leans on: listings here that took a ~2.3% cut typically sold within 7.5 days. Small cuts move metal in this market, right now.
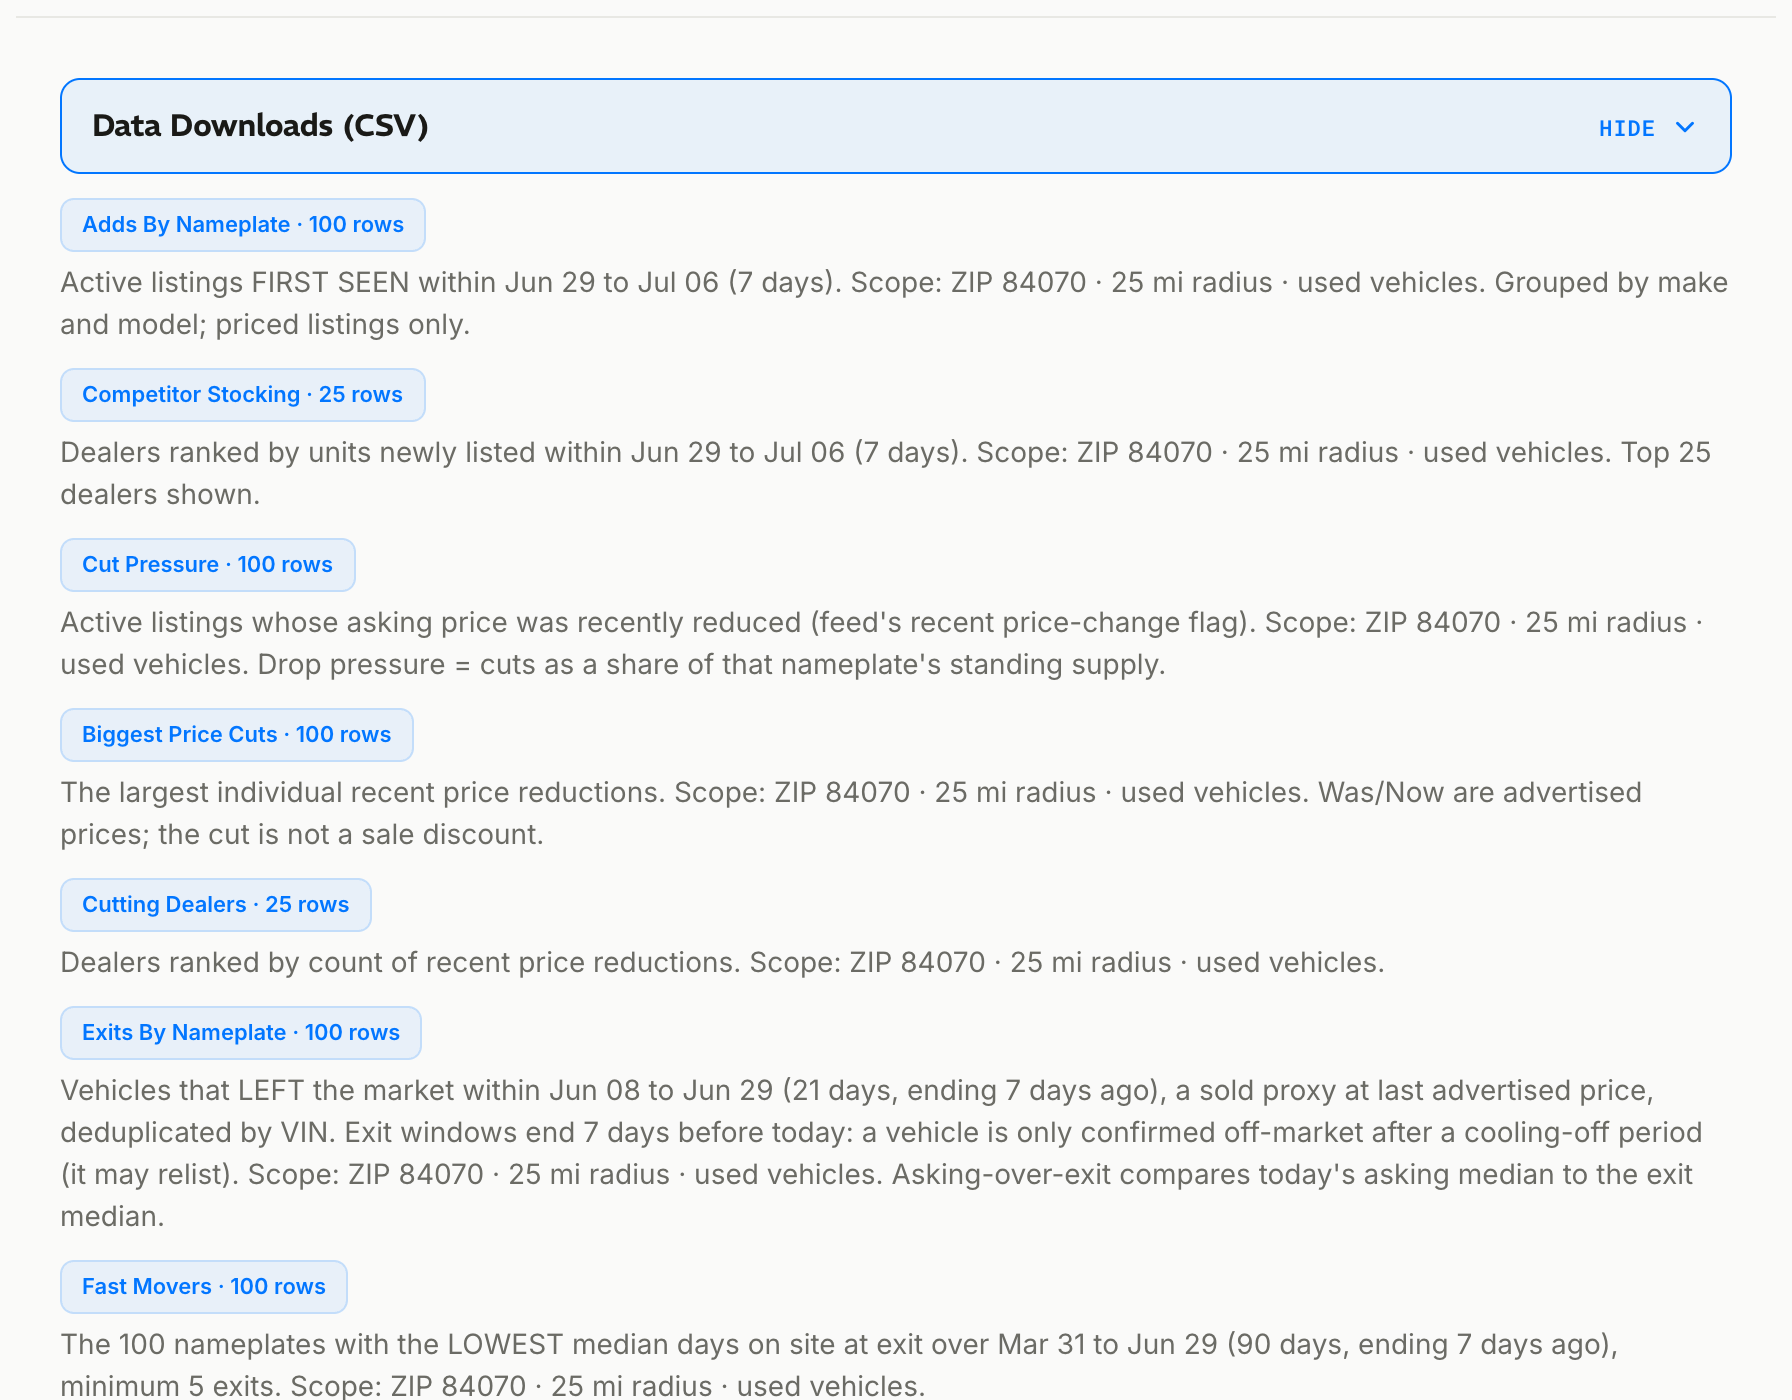
And then it stays with you. Every table publishes as a CSV data file your AI assistant can query, and five Market Data Tools ($0.01 to $0.18 per call) answer anything the capture did not: live searches, VIN histories, price predictions. The report is the start of a conversation.
Three lots, three verdicts
The franchise store: fast, premium, and sitting on a $2.2M exception
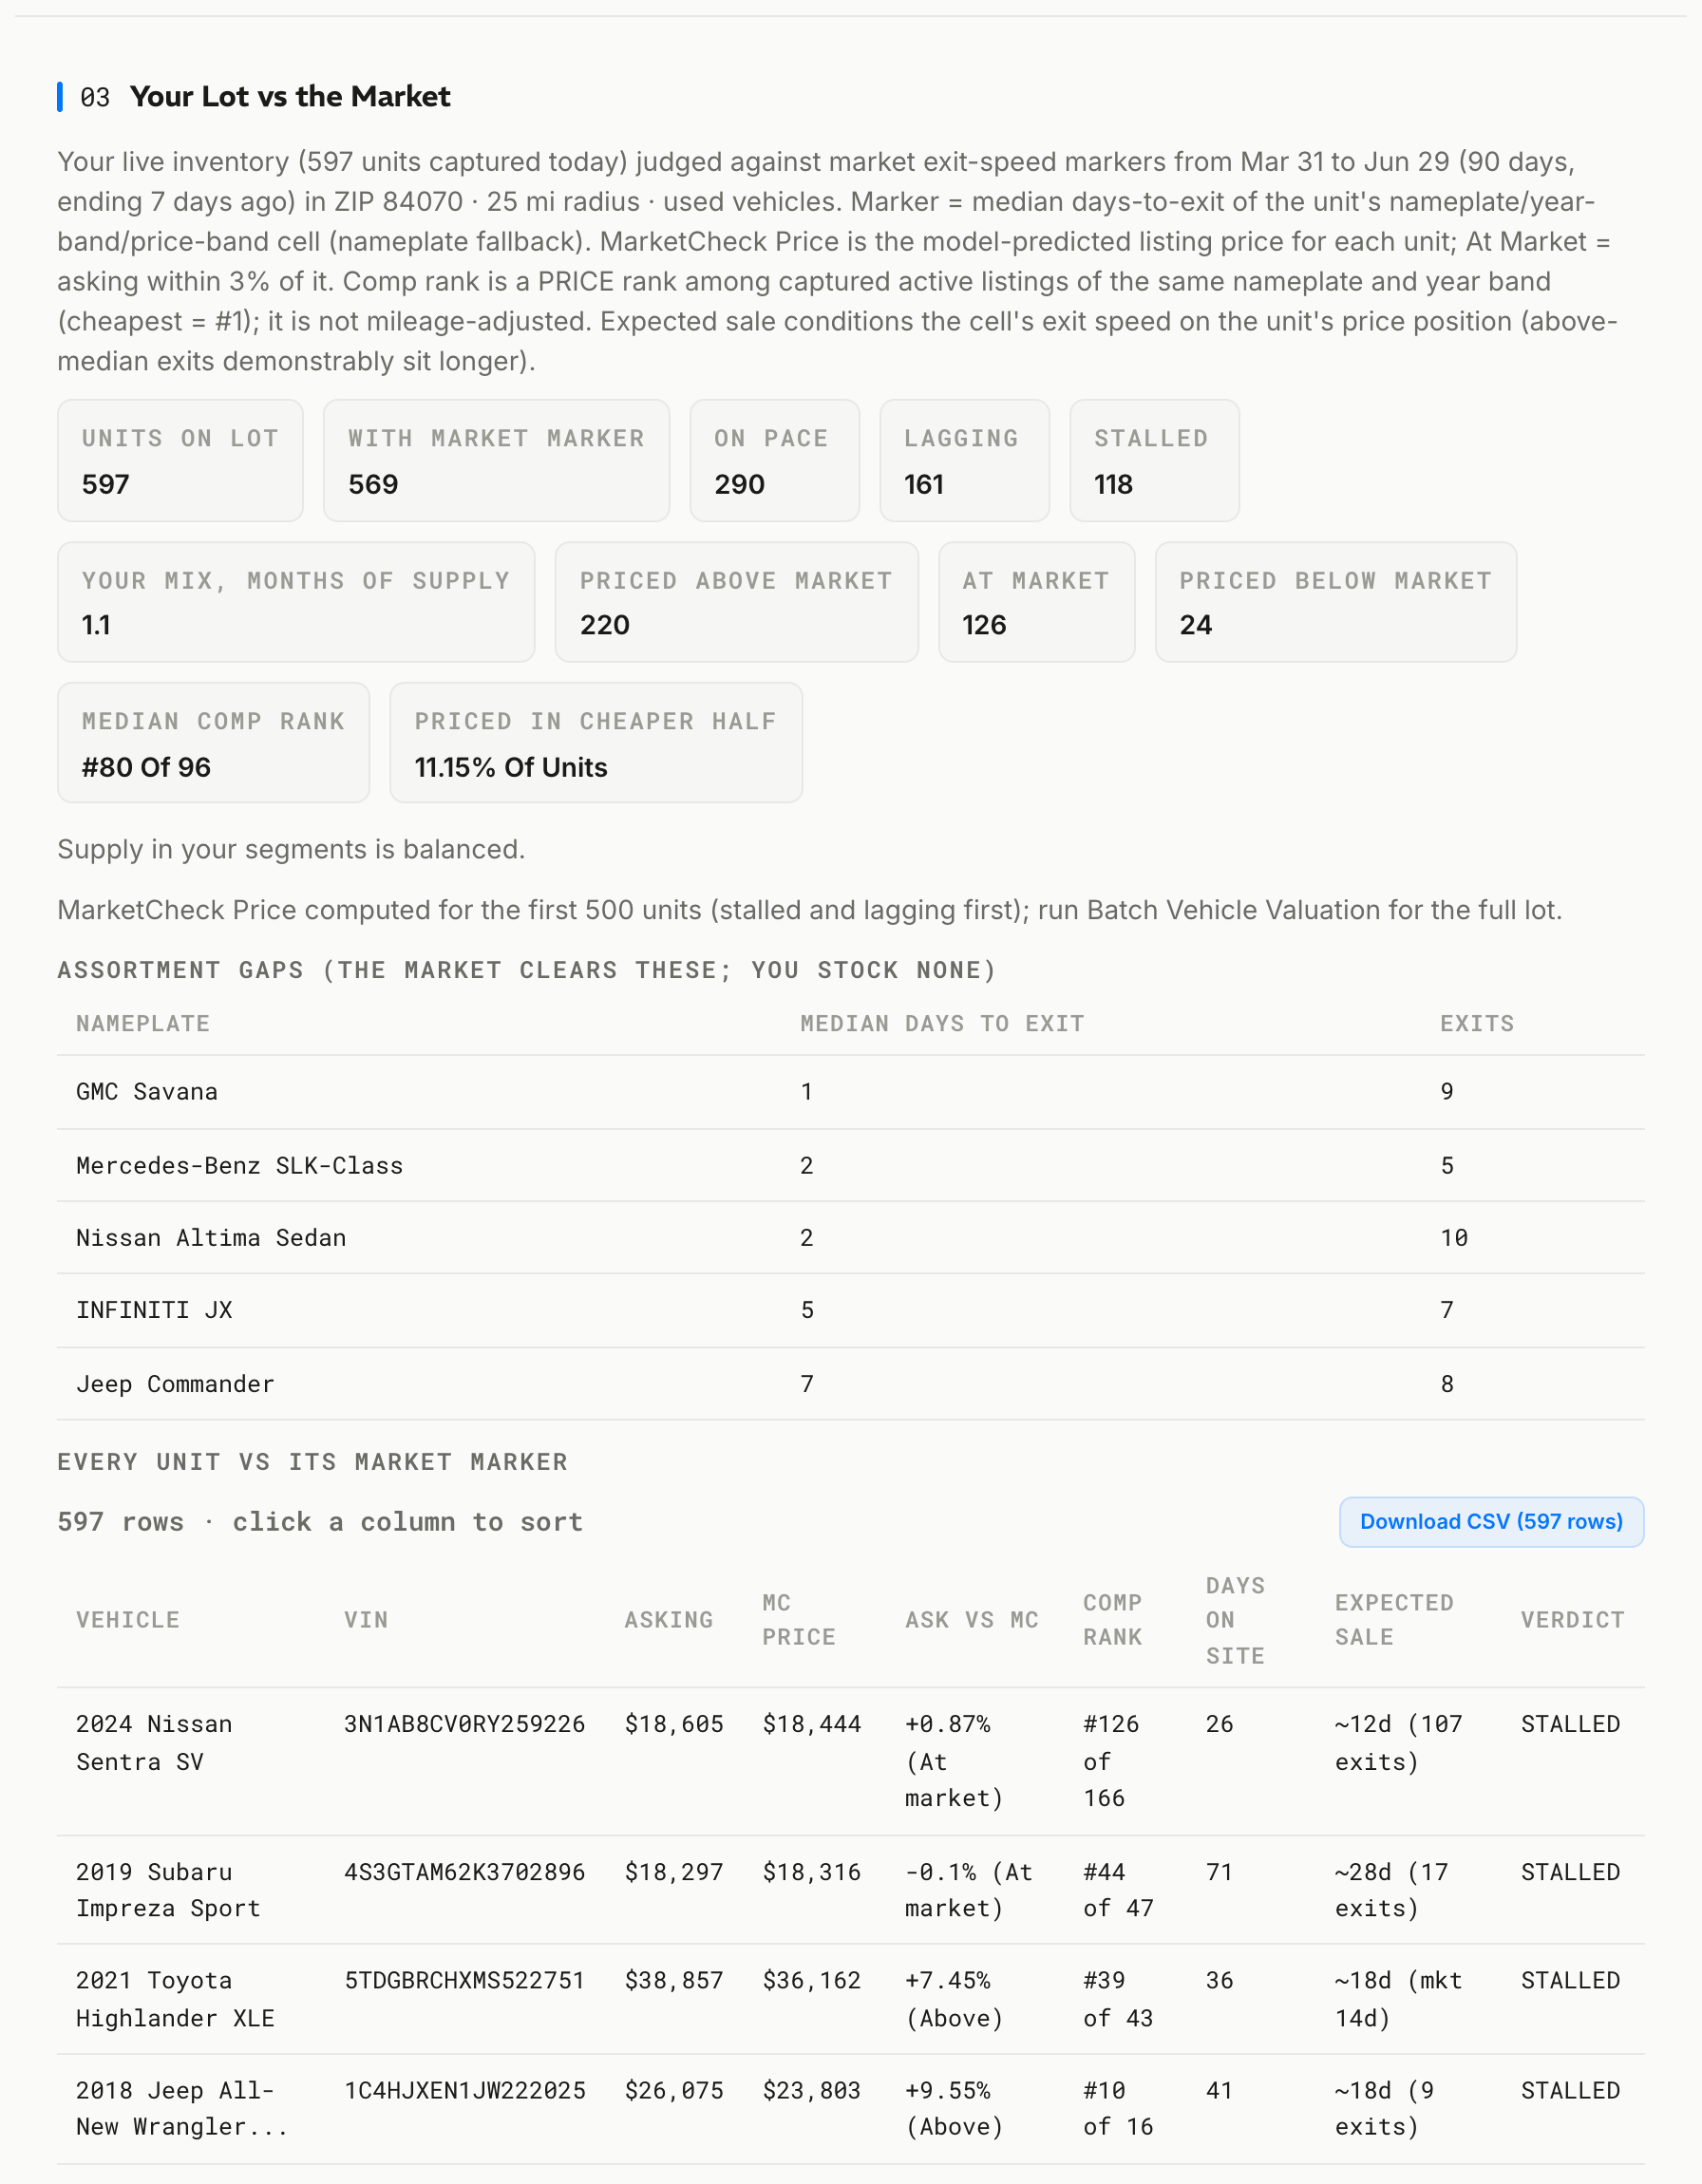
The franchise store turns inventory faster than the market itself: the dealer league table (computed from observed adds and exits) shows 492 exits at a median of 19 days against the market's 28. They do it while pricing at the top: median comp rank #80 of 96, with 220 units above their own MarketCheck Price and only 24 below. Premium pricing and fast turn, coexisting, because Toyota supply is tight here.
The exception: 118 units STALLED, 54 of them also priced above market, $2.2M in aging inventory. Poster child: a 2026 Tundra Platinum at $66,665, 182 days on site, ranked #94 of 96.
Their week: reprice the 54 (the follow-up trail below built the case for exactly how much), touch nothing on the 290 on-pace units, and push auction money into used Corollas while that lane sits at 0.3 months of supply.
The specialist: disciplined pricing with one expensive habit
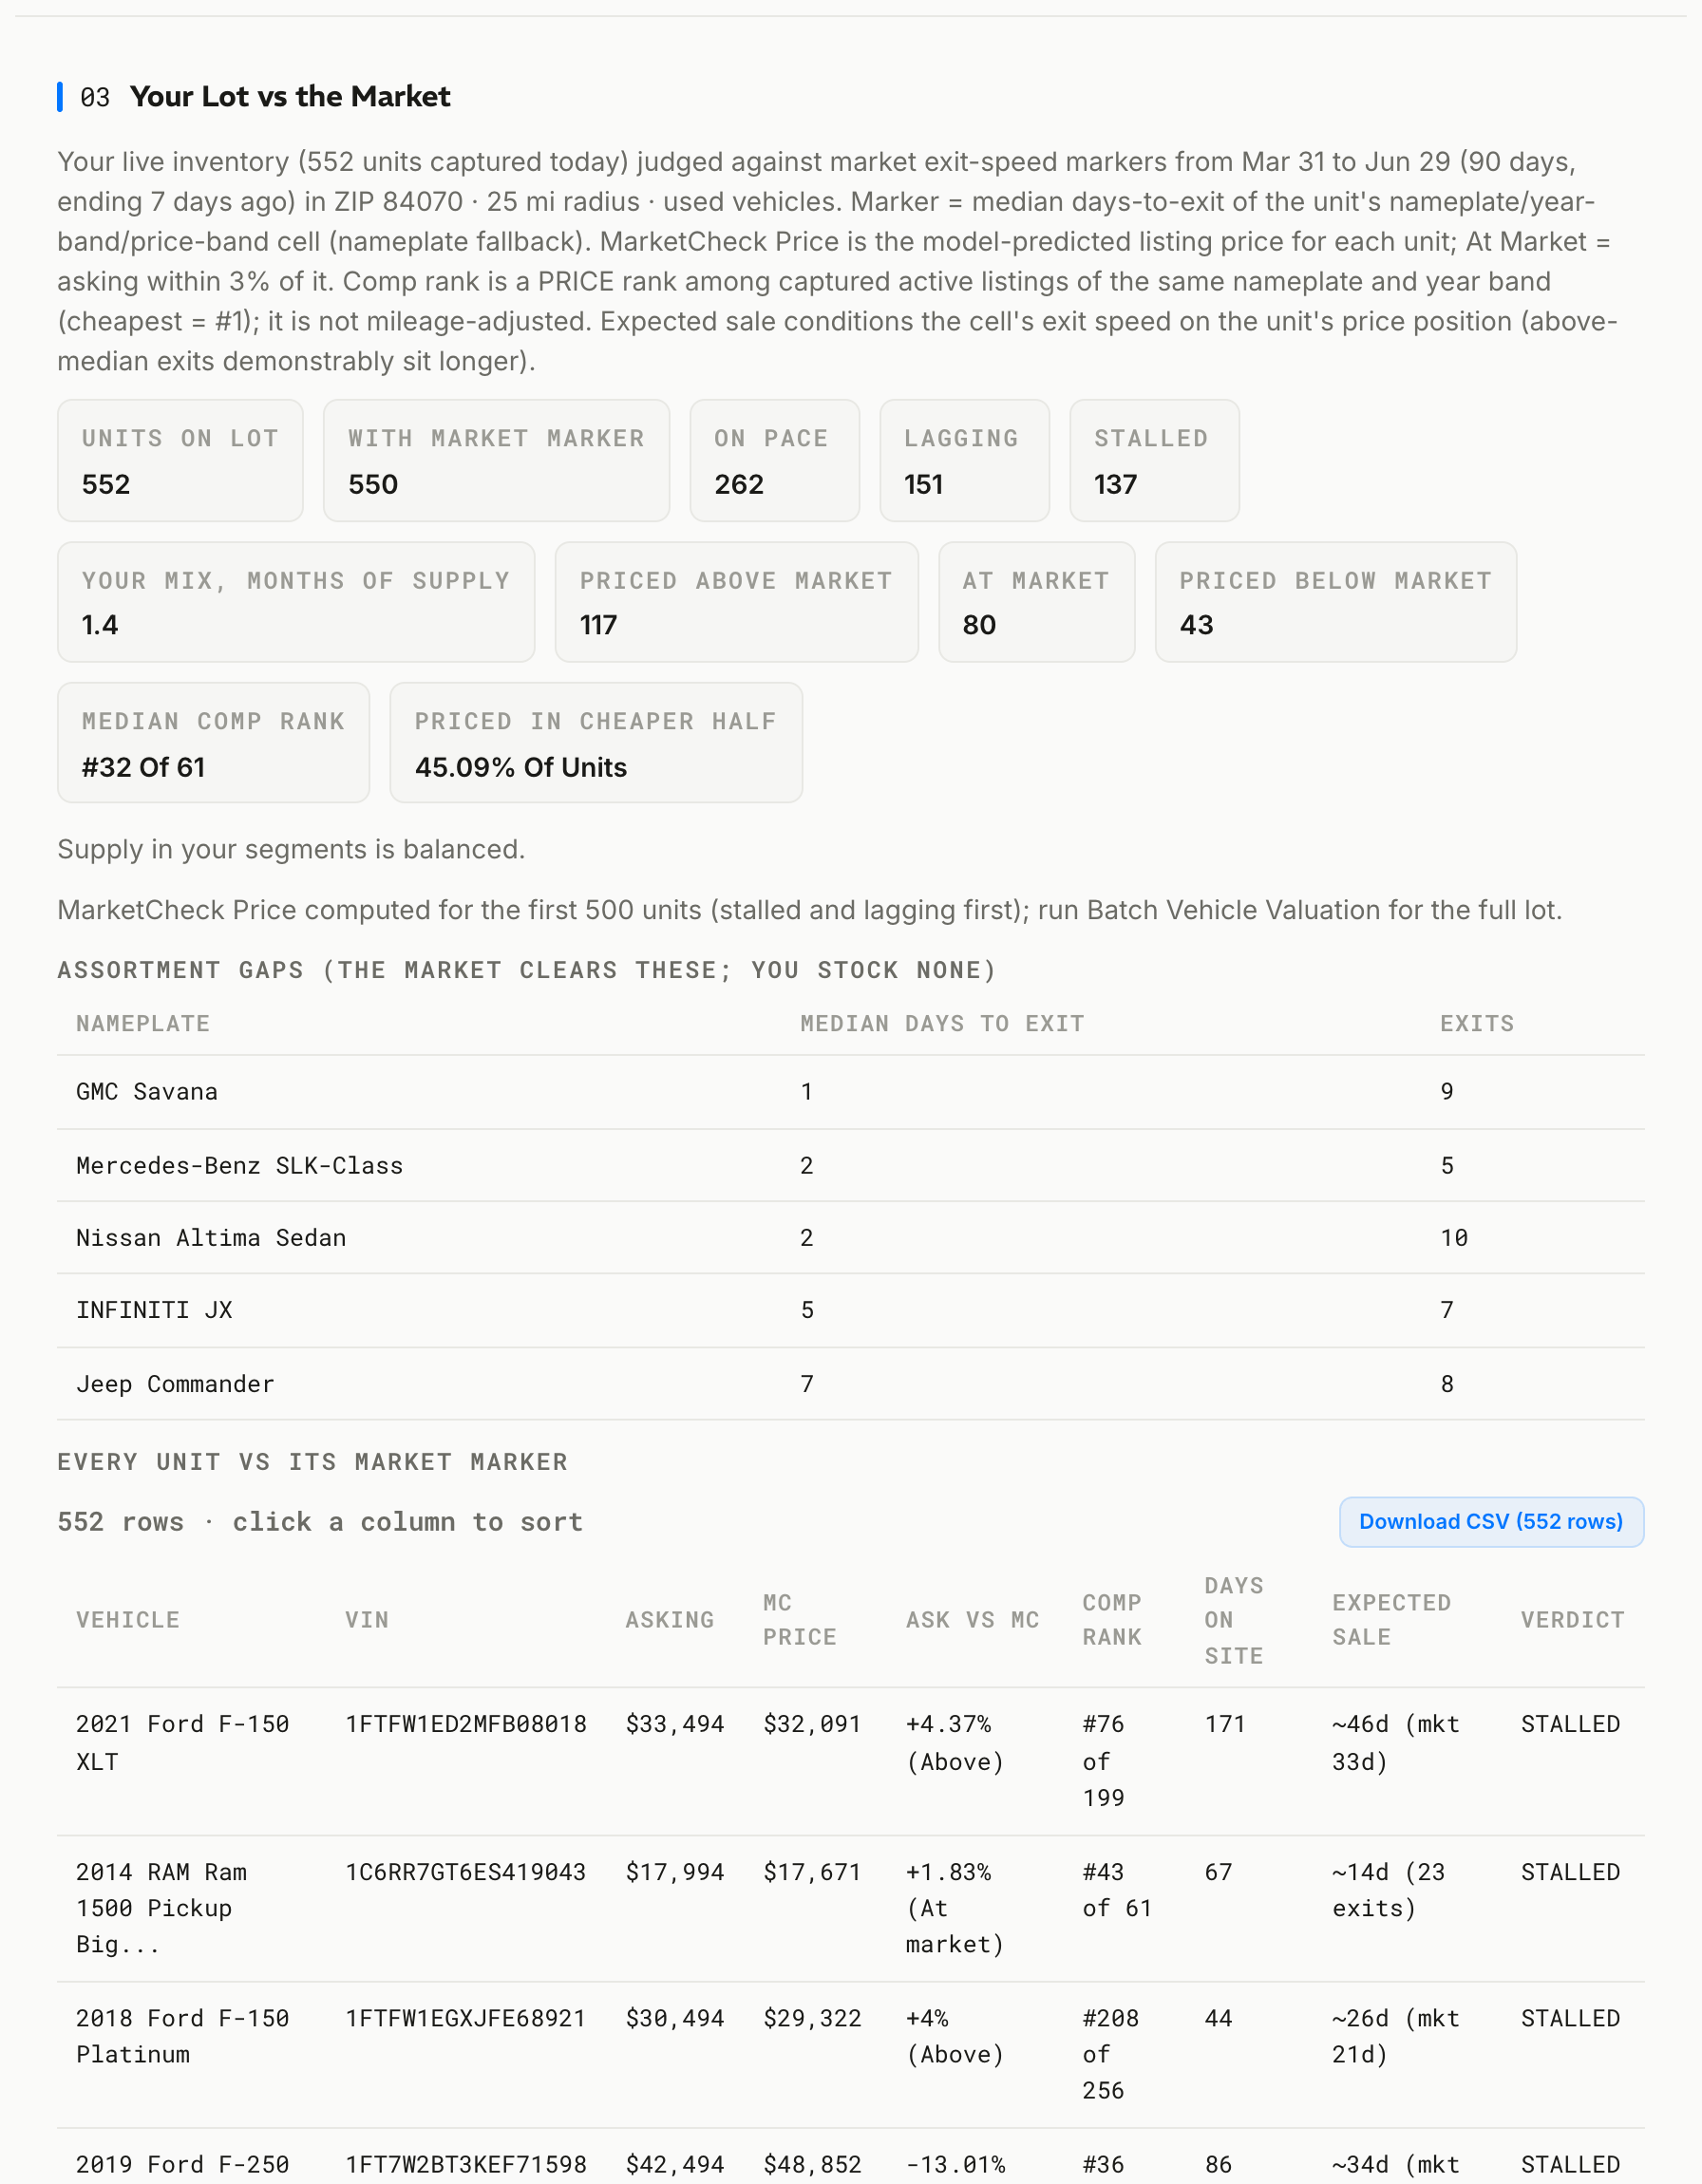
The truck specialist prices mid-pack (median rank #32 of 61), gives nothing away, and still has 41 stalled units priced above market, $1.76M, in the one market where trucks need help: diesel is Sandy's slowest fuel (36-day exits) and the half-ton nameplates are all balanced, not tight. Their signature unit, a 2021 F-150 XLT at 171 days, turned out to have a story (Q4 below).
Their week: reverse the price drift on agers, fund the cuts by raising the six units selling fast at 5%+ under market, and check the diesel velocity row weekly for the premium window to reopen.
The volume independent: right thesis, heavy tail
The EV independent is the market's third-biggest stocker this week (+106 units) with the cheapest pricing discipline of the three (median rank #23 of 44). The market validates the EV thesis: fastest fuel, healthy Tesla supply, a Model Y cell in the top five buy targets. But at 1,584 units the tail is expensive: 531 STALLED, 169 of them above market, $5.4M. And the capital triage (Q7 below) revealed the twist: the money is stuck in HD trucks and Wranglers, not EVs.
Their week: triage the stalled tail by capital, reprice the top slice to cell pace, and put a pre-purchase velocity check in front of the next 106-unit buying week.
The 10 follow-up questions that optimize an inventory
This is the part no PDF report can do. Every question below was asked in plain English against this morning's captures, in the same chat, and answered for all three stores. The responses are lightly edited for length; every figure is verbatim from the live runs.
Why you ask this
Aging plus over-market is where capital decays fastest. This is the daily reprice list.
Franchise store
Filtering your 597 judged units: 54 are both STALLED and priced above their own MarketCheck Price, holding about $2.2M.
The list leads with three 2026 Tundras: the Platinum at $66,665 has sat 182 days ranked #94 of 96 comparable Tundras, another Platinum at $71,113 has sat 118 days, and a Limited at $64,125 is at 123 days priced 6.5% over.
All three sit in cells that clear in 6 to 17 days at pack pricing, so the aging is a price choice, not a demand problem.
The rest of the list clusters in the same pattern: late-model, high-sticker, top-of-comp-set asks.
Truck specialist
41 of your 552 units match, about $1.76M.
The oldest are a 2021 F-150 XLT at $33,494 (171 days, ranked #76 of 199 F-150s, projected 46 days to sell at this ask vs 33 at pack pace) and a 2021 F-150 Lariat at $40,494 (also 171 days, 6.4% over market).
A 2022 Silverado 3500HD LT at $43,494 has sat 163 days despite ranking a reasonable #7 of 24, which suggests the HD diesel headwind more than the price.
Worth splitting this list into "price problem" and "segment problem" before cutting.
EV independent
169 of your 1,584 units match, roughly $5.4M, the largest stalled-and-over book of the three.
The examples run against the store's branding: a 2023 Wrangler Rubicon at $68,211 (148 days, #66 of 70), a 2022 Silverado 3500HD at $51,559 (148 days, priced 12% over), a 2024 Highlander LE at $37,053 that its cell says should clear in 16 days.
Your EV inventory is largely absent from this list; the tail is the non-EV metal (Q7 quantifies it).
At your scale I would triage by dollars before touching anything.
What you do with itthis is Monday's reprice list, oldest first, split by price-problem vs segment-problem.
Why you ask this
Re-check the report's comp rank against the LIVE market before the pricing meeting. This number ends the debate.
Franchise store
I searched live used Tundra listings within 25 miles priced at or below your $66,665 ask: 194 of them.
A shopper who sorts by price scrolls past 193 trucks before reaching yours.
The report ranked this unit #94 of 96 in its captured comp set; the live check says the rank was, if anything, generous.
This is not a car a buyer discovers by accident at this price.
Truck specialist
For the 171-day F-150 XLT I tightened the set to same-trim, same-generation trucks: 2020-2022 XLTs at or below your $33,494.
There are 46 of them live right now within 25 miles.
That is a smaller wall than the franchise store's, which fits your #76-of-199 rank across all F-150s, but 46 cheaper same-trim alternatives is still a long scroll for a shopper to make before choosing yours.
EV independent
For the $87,011 F-350: 209 used F-350 Super Duties are listed at or below that number in this market, out of 282 standing.
Heavy-duty trucks are a spec-driven purchase, so some of those 209 are not true rivals, but the volume alone says a buyer here has no scarcity pressure.
Combined with 128 days on site and a #69-of-114 rank, the market has answered the price question already.
What you do with itput the live count on the screen in the meeting. The debate usually ends there.
Why you ask this
Rank says where the ask sits. The prediction says the right number.
Franchise store
The Tundra Platinum predicts at $64,045 against your $66,665 ask, about $2,600 or 4% over.
Pair that with the market's own behavior, where a ~2.3% cut typically produces an exit within 7.5 days, and the move is a correction, not a fire sale.
Given the cell clears in 6 to 17 days when priced with the pack, a $63,900 ask likely retails this truck this month.
Truck specialist
The report's per-unit column already carries the answer at the truck's actual odometer: your $33,494 ask sits 4.4% over its MarketCheck Price.
The prediction with comparables adds the evidence: the comp set behind the number is deep (199 F-150s captured in this market), so the model is not guessing from thin air here.
EV independent
The F-350 predicts at $82,215 with comparables attached, against your $87,011 ask: 5.5% over.
On a truck this expensive the percentage understates the dollars; that is a $4,800 correction, and Q4 shows the price has not moved once in 128 days.
What you do with itsize every cut with the prediction plus the discount-to-exit table, and use the same tool on auction candidates BEFORE you bid.
Why you ask this
Bad price, bad unit, or bad process? The history tells you which, and the fix is different for each.
the three histories read like three different diseases.
Franchise store
The Tundra's history shows 4 listing episodes: it came to market at $71,028 and has been walked down to $66,665.
So the store IS correcting, roughly $4,400 so far; it just stopped $2,600 short of where the model says the market is.
This is the healthiest of the three histories: right instinct, incomplete follow-through.
Truck specialist
The F-150 shows 50 listing episodes, and the trail runs the wrong direction: $31,995, then $32,494, then $33,494.
The price was RAISED twice while the truck aged half a year.
Nobody decided that on purpose; it is what happens when repricing is ad hoc and a unit outlives everyone's attention.
That single history turned into a process rule (below).
EV independent
The F-350 also shows about 50 episodes, but the price barely moves: pinned at $87,011 with one brief drift to $87,600.
Nothing was raised; nothing was cut; a $87k asset simply sat untouched for 128 days.
At 1,500+ units this is the disease of scale: no per-unit attention without a system that forces it.
What you do with itthree diseases, three fixes: finish the cut you started; ban raises past 60 days unless comp rank supports them; and put a touch-every-30-days rule on every unit above $50k.
Why you ask this
Before cutting, confirm the exit lane exists.
Franchise store
Counting new and used, 1,460 Tundras left this market in the last 90 days; the used lane alone cleared 593.
That is roughly 16 a day finding buyers within 25 miles, six and a half of them used.
Demand for the nameplate is emphatically not the problem; the Platinum trim at the top of the price ladder just needs to price where its own cell clears.
Truck specialist
1,394 F-150 XLTs exited in 90 days (1,127 of them used), the deepest single-trim lane in this market.
Whatever story the 171-day truck tells, "nobody buys XLTs here" is not it.
This number is also your permission slip to be aggressive: at pack pricing, replacements are absorbable at rate.
EV independent
1,536 F-350 Super Duties left in 90 days counting new and used, 598 of them used: a far deeper exit lane than heavy-duty's reputation suggests.
The 128-day sit is therefore a pricing outcome, not a demand problem.
If the corrected price still does not move it in three weeks, then and only then investigate the unit itself.
What you do with itdeep exits mean cut with confidence; thin exits mean wholesale, transfer, or spec-buyer outreach instead.
Why you ask this
Underpriced fast movers fund the cuts. Free margin on cars that sell anyway.
Franchise store
5 units.
The standout is a 2023 Tacoma TRD Off-Road at $35,809, priced 14.7% below its MarketCheck Price and still projected to beat its cell (about 36 days vs 43).
A 2015 Venza XLE at $17,623 runs 5.3% under.
On the Tacoma alone a $2,000 to $3,000 raise is defensible while staying under market.
Truck specialist
6 units, led by a 2019 F-150 Lariat at $22,494 sitting 9.2% under market and a 2020 Armada SL at $18,094 nearly 12% under.
Both are moving at or ahead of pace.
These six raises, made the same morning as the 41 cuts, bring the whole repricing exercise close to margin-neutral, which is what makes it an easy yes for ownership.
EV independent
Zero units matched.
Your floor pricing is already exact, which is consistent with your #23-of-44 median comp rank and your zero-give-away discipline.
It also means your repricing program has no internal funding source, so the case for the stalled-tail cuts rests purely on floorplan savings, which Q7 quantifies.
What you do with itraise these the same morning the agers get cut.
Why you ask this
Hundreds of stalled units need an order: expensive old money first.
Franchise store
Your top three by capital-times-age are all 2026 Tundras: $66,665 at 182 days, $71,113 at 118, and $64,125 at 123.
One nameplate, one buying decision, one fix.
Everything below them on the list is materially smaller, so this is a three-phone-call morning.
Truck specialist
A 2025 F-150 Raptor at $88,244 and 124 days tops the list, then a 2024 RAM 3500 Limited at $77,000 and 103 days, then a 2024 F-250 at $46,494 and 159 days.
The Raptor is the interesting one: a halo truck that flatters the lot but eats floorplan; decide whether it is inventory or advertising, and price it accordingly.
EV independent
The top five hold about $380k and none are EVs: a 2025 F-350 Super Duty at $87,011 and 128 days, a 2024 Sierra 2500HD Denali at $78,539 and 141, a 2024 F-250 Lariat at $73,577 and 143, and two Wrangler Rubicons near $70,000 at about 148.
The tail that is aging is exactly the inventory outside your specialty.
Pulling these five forward by three weeks is real interest expense, before you touch the other 164.
What you do with itreprice the top slice this week; on money like this, weeks are the unit of savings.
Why you ask this
Freed capital should go into proven-fast, supply-tight cells. The capture already scored them all.
Franchise store
The market's four most liquid cells are all used Corollas: 2016-2019 at $10-15k (22.5-day exits, 0.3 months of supply, the market's top liquidity score of 961), 2015-and-older at $5-10k, 2020-2022 at $15-20k, 2023+ at $20-25k.
This is your franchise lane sitting wide open at trade-in and auction money.
Your current used lot is light here, which the assortment-gap table also flags.
Truck specialist
In your lanes: 2016-2019 F-150s at $25-30k clear in 21 days at 1.5 months of supply, 2020-2022 Tacomas at $25-30k in 23 days at 0.7 months, and the eye-opener, F-150 Lightnings at $50-55k are exiting in 5 days (thin sample: 5 exits, so treat it as a signal to watch, not a buy order).
The electric half-ton is quietly the fastest truck cell in this market, and almost nobody specializes in it.
EV independent
Your thesis cell is top-five market-wide: 2020-2022 Model Y at $25-30k, 17-day exits at 0.9 months of supply, with Model 3 cells just behind.
Given Q7 showed your aging problem is the non-EV tail, the data supports narrowing the buying, not broadening it.
What you do with itthe bid list writes itself; sanity-check any candidate cell with one question before the paddle goes up.
Why you ask this
Their adds are your future price pressure; their cuts are your undercut warning.
Franchise store
Your own league-table row is the headline: 492 exits in the window at a 19-day median, nine days faster than the market, on just 14 recent cuts.
Nobody your size in this market turns faster.
The watch item is Enterprise (+520 adds this week) stacking mainstream sedans and crossovers into your used lanes at volume pricing.
Truck specialist
The market added 172 F-150s THIS WEEK, the single biggest nameplate inflow, while Carvana Tooele leads the cut table (147 cuts at a 1.74% median).
Every one of those trucks lands somewhere near your core lane.
When supply flows in this fast, mid-pack pricing discipline (your #32-of-61 median) protects you, but the agers from Q1 get more exposed every day you wait.
EV independent
You ARE the competitor story this week: +106 adds made you the market's third-biggest stocker, behind only Enterprise and Carvana.
Worth internalizing that every rival running this same report sees that number next to your name, with your add-mix attached.
Volume buying is a strategy; broadcasting it is a side effect.
What you do with itwhen a volume player stacks your lane, price ahead of the wave, not after it.
Why you ask this
The last points of margin hide in mix details gut feel gets wrong.
The market
the $10-15k band is the most tightening segment in Sandy (+1.97% exit-share vs add-share); green and beige cars quietly clear in about 26 days against the pack's 28, while brown is the most over-stocked color relative to what actually exits; and 13.9% of "exits" reappear as active listings, meaning roughly one in seven disappearances was a relist or failed deal, not a sale.
That churn rate is the honesty discount to apply to anyone's "sold" statistics, including these.
Per store
The franchise store holds just 14 units in that tightening $10-15k band and the truck specialist 8, both underexposed to the segment shoppers are draining fastest; the EV independent holds 88, the best positioned of the three, and could lean in further at appraisal time.
What you do with itweight appraisals toward the tightening band, stop reflexively discounting colors that actually move, and quote sold statistics net of churn.
The bill for the follow-ups, answering all ten questions across all three stores: $0.69. That is on top of the three reports themselves (about $100 each). Two thirds of the answers came from the report and its CSV data files at no extra cost; the rest used the live Market Data Tools at $0.01 to $0.18 a call. The assistant always picks the cheapest layer that answers.
Why dealers keep it running
- It ends arguments with evidence. "#94 of 96" and "194 cheaper Tundras" close pricing meetings that opinions never could.
- It reads both halves of the market. Active supply says what you compete with; 90-day exits say what actually moves, how fast, at what price. Stocking and pricing decisions need both.
- It scales down and up. A 45-unit lot gets the same per-unit verdicts as the independent's 1,584.
- It compounds. Same-day re-runs reuse the capture and are nearly instant; schedule it weekly as a monitor and the diffs come to you.
Run it on your store
- Connect MarketCheck AI Desk to Claude or ChatGPT: one consent screen, and you choose exactly which reports and data tools it may use.
- Ask: "Run a Full Market Capture for my market, my store is yourdomain.com." You get the free quote with the exact row count first.
- Read your ten minutes. Then start asking the ten questions.