
Record Q2 negative equity of $6,884 lands as used asking prices rise 4.3%: the hole is in the loans
US used asking prices rose year on year while trade-in negative equity set a second-quarter record.
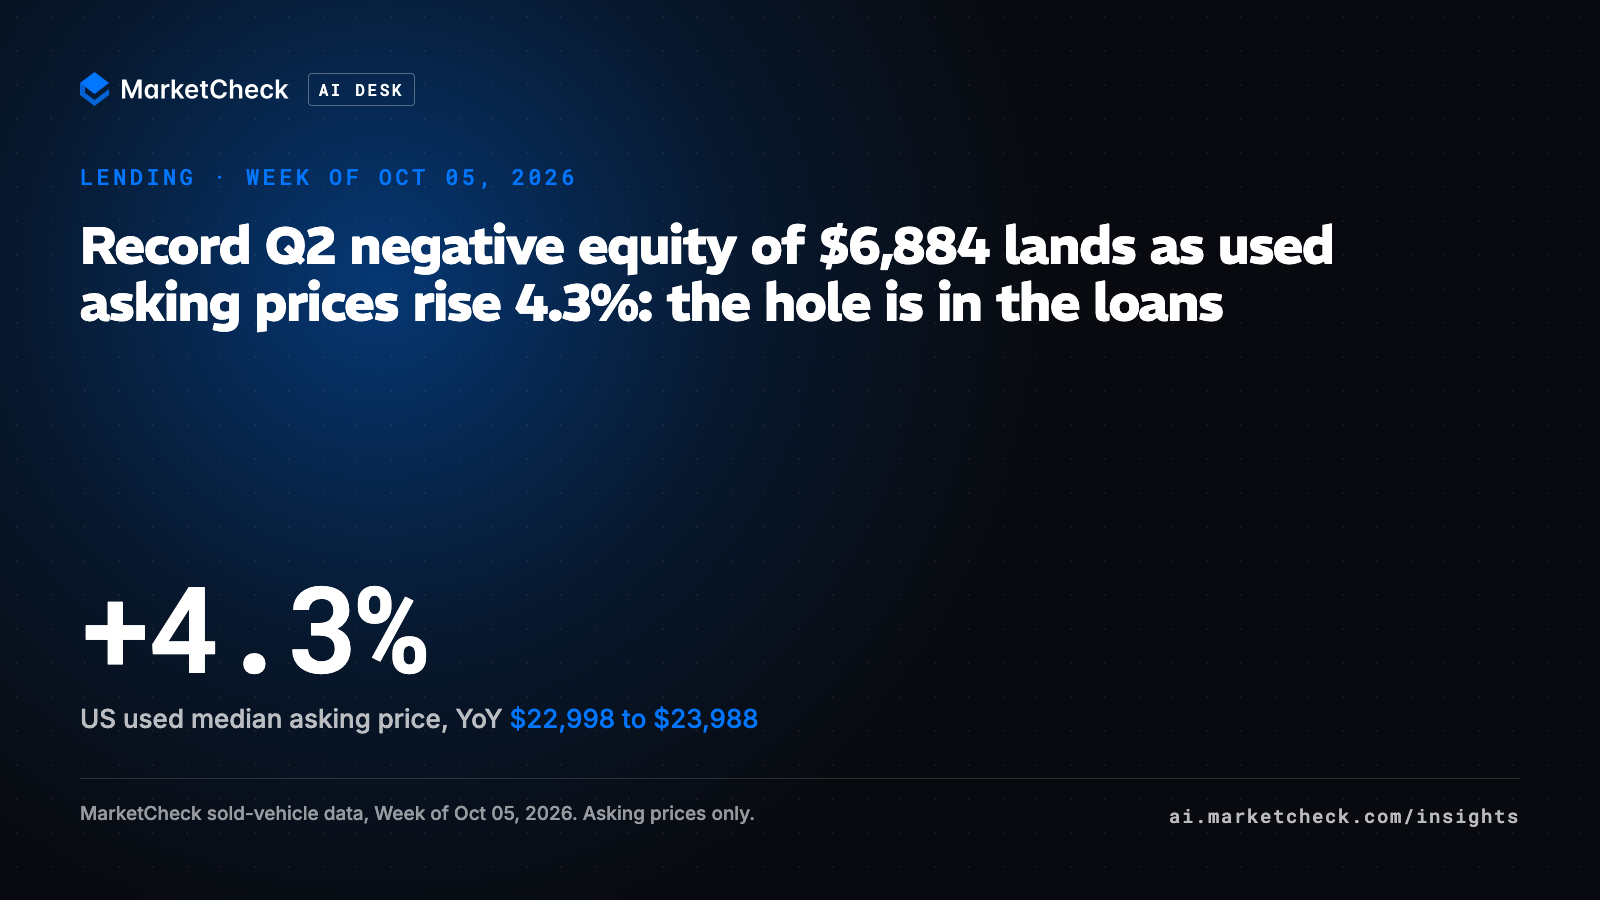
On Sep 30, 2026, TradersUnion.com, citing Edmunds, reported that average negative equity on US auto trade-ins reached $6,884 in Q2 2026, the highest figure for any second quarter on record. The story links that record to longer loans, noting that 43% of buyers who rolled negative equity into a new loan chose an 84-month term. The US used market, read against MarketCheck sold-vehicle data from franchise and independent dealer websites, moved the other way over the same stretch: the median asking price rose 4.3% year on year, to $23,988 in Aug 2026 from $22,998 in Aug 2025. Retail collateral firmed while the equity hole deepened, which points the explanation at loan balances and term length rather than at falling car values.
What the data shows
| Measure (US used, dealer websites) | Aug 2025 | Aug 2026 | Change |
|---|---|---|---|
| Median asking price ($) | 22,998 | 23,988 | +990 (+4.3%) |
| Mean asking price ($) | 26,503 | 27,350 | +847 (+3.2%) |
| Median mileage (miles) | 61,714 | 58,947 | -2,767 (-4.5%) |
| Median days on market (days) | 25 | 26 | +1 |
| Mean price vs MSRP (%) | -38.56 | -38.20 | +0.36 pts |
| Used sales (units) | 1,738,262 | 1,709,132 | -1.7% |
Read: used asking prices rose year on year on lower-mileage cars while sales slipped 1.7%, so collateral firmed without a demand surge. Price rows are medians or means of advertised asking prices on dealer websites, and the MSRP row is a mean discount, not a per-car figure.
The monthly path fills in the shape. The median bottomed at $21,998 in Feb 2026, climbed 9.0% to $23,988 by Aug 2026, and has effectively held since May 2026, when it stood at $23,914, a move of 0.3% across three months. Median days on market moved from 25 in Aug 2025 to 26 in Aug 2026, so the firmer pricing did not come with faster turn.
Why it matters
The hole grew while collateral firmed. Edmunds puts average negative equity at $6,884 in Q2 2026. Over a comparable window, MarketCheck data shows the median used asking price up 4.3% year on year. When retail values rise and the gap widens anyway, the pressure is coming from the balance side of the ledger.
Terms are stretching. Edmunds reports that 23.9% of Q2 2026 new-vehicle financers signed for 84 months or longer. MarketCheck research notes that loans past 72 months reached 31.3% in Aug 2026. Longer terms keep balances above value for longer, so the next trade-in tends to arrive underwater again, which shapes how dealers appraise trades against payoff.
The price climb has flattened. The median sat at $23,914 in May 2026 and $23,988 in Aug 2026.
Older cars are the soft spot. MarketCheck research shows the median asking price for 2012 to 2019 model-year cars fell to $15,250 in Aug 2026 from $15,990 in Aug 2025, even as the overall market rose. An underwater trade on an older car loses ground on both sides.
Borrower strain is already visible. LendingTree, citing New York Fed data, puts the 90-day auto loan delinquency rate at 5.5% in Q2 2026, after a record 5.6% in Q1 2026. Rolled-in negative equity raises the loss on each default.
What to watch
- The used median through Sep 2026 and Oct 2026. Holding near $24,000 would describe a plateau rather than a continued climb.
- Edmunds' Q3 2026 negative equity figure against retail asking prices. A deeper hole on flat collateral would further confirm that term length, not values, is doing the work.
- Pricing for 2012 to 2019 model-year cars. If that cohort keeps falling while the overall market holds, underwater trades of older vehicles are where the gap widens fastest.
- Delinquency against the 5.6% Q1 2026 record.
- Days on market, which moved only from 25 to 26 year on year. A sustained rise alongside flat prices would signal that firmer asking prices are not clearing as readily.
How this was measured
Method: monthly sold-vehicle statistics from US franchise and independent dealer websites. Figures are advertised retail asking prices, not transaction or wholesale trade-in values, and exclude auctions and private sales. Year on year compares Aug 2026 with Aug 2025. Negative equity and loan-term figures come from Edmunds. Off-market and sold rows here are last-list prices used as a sold proxy, not prices paid.
API used: MarketCheck Sold Summary API (the get_sold_summary tool in the MarketCheck MCP; docs https://docs.marketcheck.com/docs/get-started/api/mcp/tools/sold-summary). Queries covered national used inventory for Aug 2025 and for Sep 2025 to Aug 2026. API keys: https://developers.marketcheck.com.
The story we checked
"Record Negative Equity in US Auto Trade-Ins and Longer Loan Terms Pressuring Borrowers", TradersUnion.com (citing Edmunds), Sep 30, 2026. Fact-check tally: 4 verified, 1 unverifiable. The $6,884 average is verified by Edmunds, and verified as a record only for a second quarter rather than all time. The 43% share of negative-equity buyers taking 84-month loans is verified for Q1 2026 rather than Q2 2026. The spread of longer terms is verified at 23.9% of Q2 2026 new-vehicle financers at 84 months or longer. The claim that falling vehicle values are driving negative equity runs against MarketCheck sold-vehicle data, where the median used asking price rose 4.3% year on year to Aug 2026.
You can run the same read in MarketCheck AI Desk (install: https://ai.marketcheck.com/install).
Reproduce this
- search_past_90_days: Search recently sold US dealer listings with filters such as make, model, state or ZIP to see last-list prices behind the used median.
- search_active_cars: Search live US dealer listings by make, model, state or ZIP to compare current asking prices with the Aug 2026 median of $23,988.
- generate_brand_model_market_pulse: Read used asking-price and days-on-market medians for one make, model and model year, nationally or by state, to see where older model years are softening.
- predict_price_with_comparables: Price a single VIN against comparable listings when appraising a trade against its payoff.
The story we checkedRecord Negative Equity in US Auto Trade-Ins and Longer Loan Terms Pressuring Borrowers, TradersUnion.com (citing Edmunds), Sep 30, 2026