
CarMax bought 13.8% used-unit growth with price: its premium over the US used median fell to $1,010 in Aug 2026
US used retail, week of Oct 05, 2026: CarMax traded asking price for unit growth.
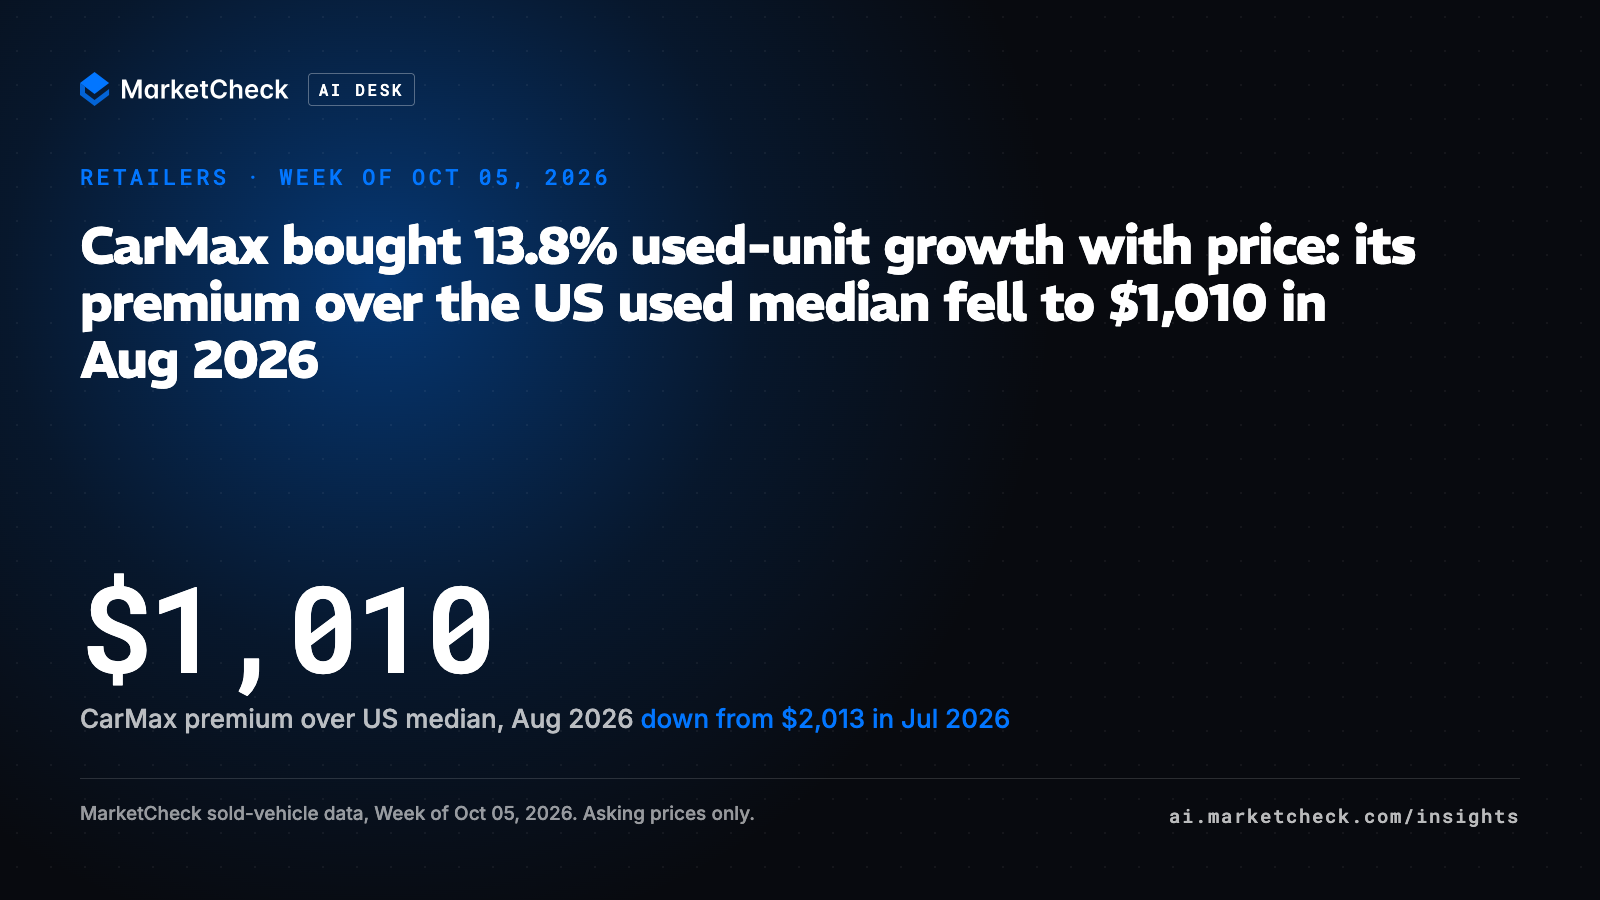
Business Wire reported on Sep 29, 2026 that CarMax's second-quarter fiscal 2027 revenue rose 19.5%, to about $7.9 billion, and that retail used unit sales rose 13.8%, while gross profit per retail used unit fell $111 to $2,105. MarketCheck sold-vehicle data for the US market, drawn from vehicles sold off US franchise and independent dealer websites, shows where that growth came from: CarMax's median last-list asking price fell to $24,998 in Aug 2026, which halved its premium over the US used median to $1,010. In Jun 2026 and Jul 2026 that premium sat near $2,000. Dealers selling between $20,000 and $30,000 are now pricing against a cheaper CarMax than they were in early summer.
What the data shows
| Month | CarMax used sales (units) | CarMax used sales, same month 2025 (units) | CarMax change YoY (%) | All US used sales change YoY (%) | CarMax median ask ($) | US used median ask ($) | CarMax premium ($) | CarMax premium, same month 2025 ($) |
|---|---|---|---|---|---|---|---|---|
| Jun 2026 | 71,048 | 61,886 | +14.8% | +2.7% | 25,998 | 23,986 | 2,012 | 1,008 |
| Jul 2026 | 73,080 | 62,999 | +16.0% | -6.6% | 25,998 | 23,985 | 2,013 | 1,008 |
| Aug 2026 | 74,805 | 66,022 | +13.3% | -1.7% | 24,998 | 23,988 | 1,010 | 1,000 |
CarMax outgrew the US used market, which rose 2.7% in Jun 2026 and then fell, in every month of its fiscal quarter, and the $1,000 cut to its Aug 2026 median ask brought its premium back to the Aug 2025 level while the US median held within $3 from Jun to Aug 2026. All prices in the table are median advertised asking prices on priced sales, a last-list sold proxy, not transaction prices.
Why it matters
The wider CarMax premium has closed. For two months CarMax's median ask sat about $2,000 above the US used median. By Aug 2026 the gap was $1,010, roughly where it stood in Aug 2025. Stores that built their own asking prices off the wider CarMax spread have about $1,000 less headroom on comparable units.
The volume came from share, not from a rising market. MarketCheck data shows CarMax's used sales off its website rose 14.8%, 16.0% and 13.3% year on year in Jun, Jul and Aug 2026. All US dealer used sales rose 2.7% in Jun, then fell 6.6% in Jul and 1.7% in Aug, to 1,709,132 units in Aug 2026 from 1,738,262 a year earlier.
The nearest online rival is growing faster at a higher ask. Carvana's used sales rose 43.1% from Aug 2025 to Aug 2026, to 73,484 units, against CarMax's 74,805. Carvana's Aug 2026 median ask of $25,590 sits above CarMax's $24,998, a difference of $592 at the median. The two franchise groups in the same set moved the other way: Lithia Motors used sales fell 15.3% to 28,175 units and AutoNation fell 10.7% to 25,991.
The mix behind those asks is lower-mileage. CarMax's Aug 2026 median sold vehicle carried 39,617 miles, against 47,297 at Carvana, 50,771 at Lithia Motors, 50,437 at AutoNation and 58,947 for all US dealers. Median days on market was 25 for CarMax, against 26 for the US market.
Unsold stock is aging. MarketCheck research shows 85,709 used cars listed on CarMax's website on Sep 28, 2026, at a median ask of $28,169 and a median of 86 days on market. Further markdowns are most likely on those aged units.
What to watch
- CarMax's Sep 2026 median ask. If it holds at or below $24,998, dealers in the $20,000 to $30,000 band should expect the narrower gap to persist and reprice comparable stock accordingly.
- The 86-day CarMax listings. Markdowns on that aged inventory would mark a second round of price moves, and would show up in retail asking prices before it shows up in the quarterly numbers.
- Wholesale. Cox Automotive reports mid-Sep 2026 wholesale used values 0.4% below Sep 2025, while the US used retail median rose 4.3% from Aug 2025 to Aug 2026. Cheaper auction buys would let CarMax rebuild per-unit gross without raising asks.
- The monthly Carvana and CarMax ask gap. Carvana asks $592 more at the median today. A CarMax that keeps undercutting would put further pressure on franchise used volumes.
How this was measured
The data covers vehicles sold off US franchise and independent dealer websites, with auctions and private sales excluded. Figures are monthly medians of advertised asking prices, a last-list sold proxy rather than transaction prices, and year on year compares the same calendar month. CarMax's fiscal Q2 covers Jun to Aug 2026. Figures were pulled with the MarketCheck Sold Summary API (the get_sold_summary tool in the MarketCheck MCP; docs https://docs.marketcheck.com/docs/get-started/api/mcp/tools/sold-summary), using national used summaries for Jun 1 to Aug 31 in both 2026 and 2025, ranked by dealer group and against US used totals. Wholesale and index figures are from Cox Automotive, and revenue, unit and gross-profit-per-unit figures are from the company release and the outlets cited below. API keys: https://developers.marketcheck.com.
The story we checked
"CarMax Reports Second Quarter Fiscal 2027 Results," Business Wire, Sep 29, 2026. Fact-check tally: 5 verified, 0 unverifiable, covering the 19.5% revenue rise to about $7.9 billion, the 13.8% retail used unit gain, the $111 fall in gross profit per retail used unit to $2,105, the in-quarter price cut, and the mid-Sep 2026 wholesale reading against the 4.3% rise in the US used retail median.
You can run the same read in MarketCheck AI Desk.
Reproduce this
- search_active_cars: Search live dealer listings by make, model, state or ZIP to compare current asking prices on the units you stock.
- generate_market_movers: Rank nameplates in one local market to see which used models are moving there.
- generate_full_market_capture: Pull a market briefing for one ZIP and radius to read the whole local used picture at once.
The story we checkedCarMax Reports Second Quarter Fiscal 2027 Results, Business Wire, Sep 29, 2026